As a fellow momentum stock and FANG member Netflix (NFLX) has seen some huge gains in 2018.
Cyclical stocks have outperformed, with tech being a notable sector. This is nothing new, as tech stocks have provided leadership within this leg of the bull market for several months.
And thus, a strong growth company like Netflix found itself in the sweet spot.
To be clear, Netflix (NFLX) is one of my favorite stocks. There is a long term Point and Figure price objective of 411. But price is getting stretched near-term and this momo darling is prone to quick sharp corrections. So careful here.
Here are some general observations of Netflix stock price right now:
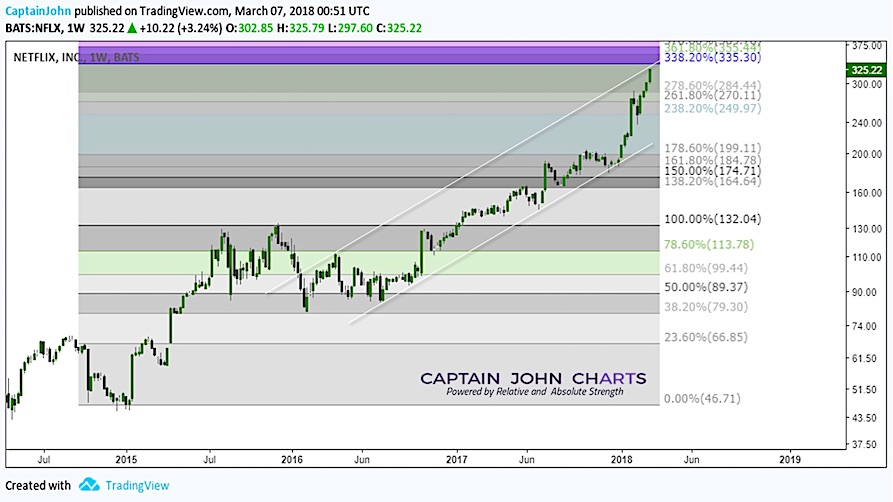
- Price is hitting parallel channel resistance.
- This also coincides with 338.20% Fibonacci price resistance.
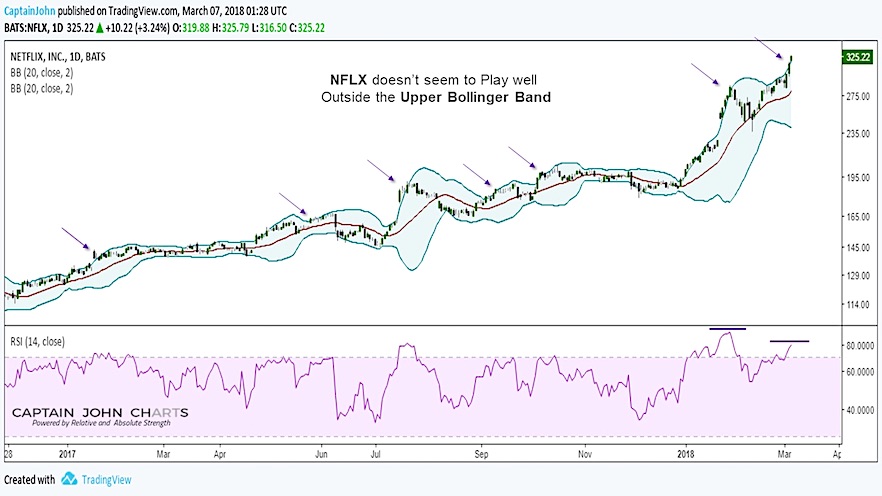
- The upper Bollinger Band has been pierced and this is not usually a friendly development for price.
If you are interested in learning more about our investing approach and financial services, visit us at CaptainJohnCharts.
Twitter: @CptJohnCharts & @FortunaEquitis
The author may have a position in mentioned securities at the time of publication. Any opinions expressed herein are solely those of the author, and do not in any way represent the views or opinions of any other person or entity.


