Much has been made of the perceived decline in volatility in Natural Gas and power prices in the last few years. When LMPs (Locational Marginal Price of power) and natural gas prices are generally low versus historical norms, natural gas tends to be the LMP-setting mechanism on a macro level – rising natural gas prices lead to higher LMPs and vice-versa.
On the Natural Gas (NG) side, volatility (as a percentage of price) has actually been rather steady in the last few years, not declining. The caveat though is the price of NG is quite low versus even the 10-year average, so on a dollar-basis, NG volatility has certainly been lower than where it was when NG traded above $5/MMBtu from 2003 to 2008.
In my opinion, the best gauge of natural gas volatility is from the infamous natural gas exchange traded product (NYSEARCA:UNG).
For background, the United States Natural Gas ETF (UNG) suffers from roll yield risk, meaning if the natural gas futures (NG) curve is in sharp contango (which it quite often is), a situation in which the nearer-term contracts trade well below the forward months, then UNG must continually purchase the more expensive 2nd and 3rd term months and sell the cheaper prompt month – this is termed negative roll yield. Negative roll yield is a raw deal for those who are long UNG, however it is nearly irrelevant when analyzing the volatility of NG.
The danger of using prompt-month natural gas to analyze volatility is the occasional massive roll gap (when the prompt month shifts from one month to the next). We have seen roll gaps of 10% or more in the past few years, and these occurrences heavily distort the arithmetic of prompt month natural gas volatility. UNG is not subject to roll-gaps since traders effectively price-in the roll gaps on the continuously-traded UNG product. For these reasons, below is the chart of average annual volatility on UNG (as a proxy for NG) as well as a weekly chart of prompt-month NG since 1990.
UNG Exchange Traded Product Average Annual Volatility since Inception (2007)
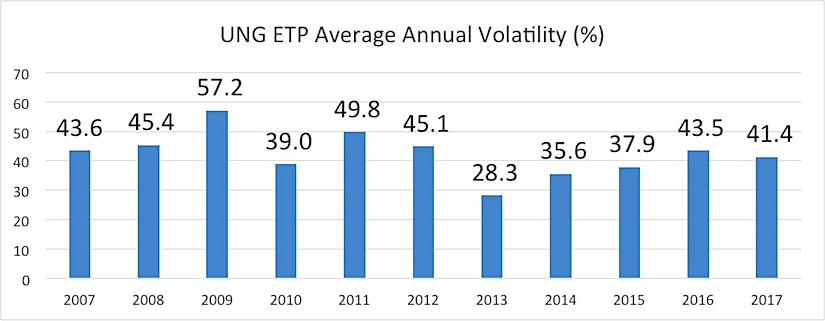
The mid-2000s commodities bull market led to increasing volatility, culminating in the commodity collapse of late 2008 and early 2009. 2013 was a year of some recovery in the price of NG following the spring 2012 low below $2, thus NG volatility had its lowest average reading in the last 11 years in 2013. Natural gas volatility steadily climbed higher as back-to-back cold winters in early 2014 and 2015 caused short-term pops and drops in NG prices. Early 2016 was the ultimate collapse of NG prices to near $1.60, so while price was low, a move of a few cents was a multiple-percentage move, which lifted volatility levels. And here we are now hovering with what seems to be near-normal volatility of around 40-45% on UNG as prices hold fast to the $3 mark on prompt-month NG.
Natural Gas Prompt Month: Weekly Chart since 1990 with 260-Week (5-Year) Moving Average
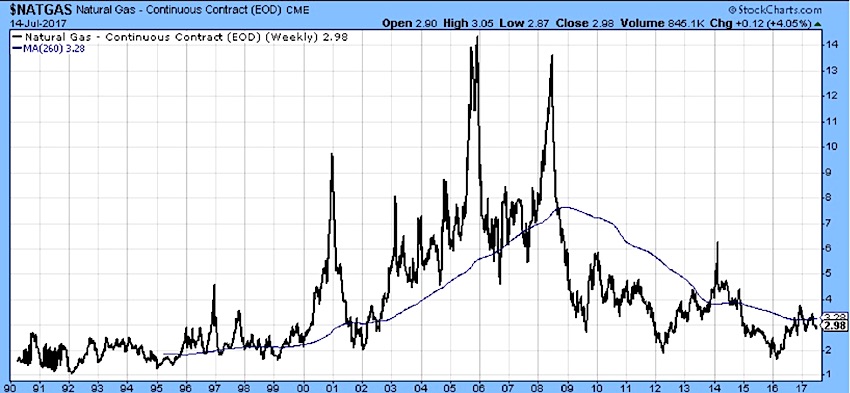
Above is a weekly chart of prompt-month NG since 1990 with a 260-period moving average (5 years). Prices have generally been below the 5-year average since late 2008 aside from during and just after the Polar Vortex of 2014.
What does it all mean?
While the Natural gas volatility on a percentage basis (which is the customary definition of ‘vol’) is near historical norms, generally declining Natural gas prices (NG) since 2008 has led to a decline in volatility on a dollar basis. The power markets really don’t care if NG moves a few cents, even if that means a more than 1% NG price move, so we have seen a decline in power price volatility despite NG vol holding steady.
Think about it this way – a 5% move on $1.60 NG is 8 cents. The power market might move a little bit, but certainly nothing to write home about. But a 5% move on $10 gas is 50 cents – LMPs will move tremendously in that scenario, making it more economically feasible to put on speculative power market transactions. Lower volatility and dollar-volatility in LMPs means spreads will be narrower between points and from period to period, leading to fewer economically feasible speculative chances.
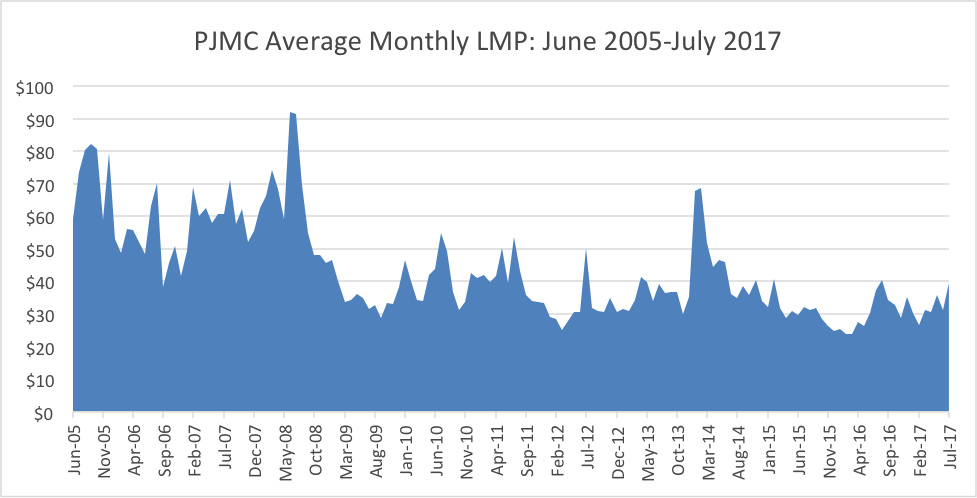
Locational Marginal Power Price at the PJMC Trading Hub (Interface between the MISO & PJM Midwest Markets)
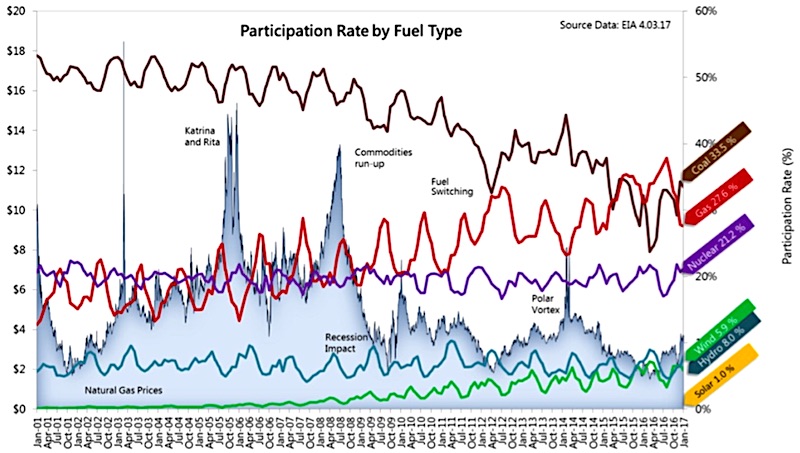
US Power Generation Fuel Mix & Natural Gas History: January 2001-January 2017
Thanks for reading.
Twitter: @MikeZaccardi
Any opinions expressed herein are solely those of the author, and do not in any way represent the views or opinions of any other person or entity.


