This was the warmest winter on record according to many sources and apparently February and March were the warmest they have ever been as well. This is one reason investors have pointed to in understanding why Natural Gas prices have fallen – along with supply rising to historic levels as well.
There’s been much discussion over the weather impact of La Nina, which is expected to shake things up this year with potential hurricanes and droughts across the globe. The National Oceanic and Atmospheric Administration predict a 40% chance of a related event by September. Luckily, as chart-focused traders we don’t have to be overly concerned with weather predictions. So let’s see what price is telling us about Natural Gas….
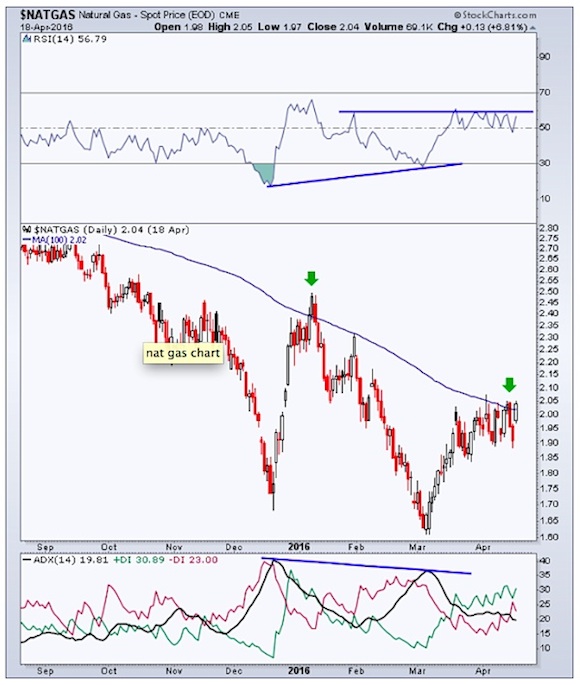
Spot natural gas prices have risen over 25% since their March low, sending the price action right back up to its 100-day Moving Average and creating a false breakdown below the prior December low. The 100-day MA was last tested back in early January as traders were unable to maintain their bullish bias and keep price from declining. As price ‘digests’ this previously important Moving Average, it appears momentum and trend strength are favoring higher natural gas prices.
Focusing on momentum, in the top panel of the chart below we have the Relative Strength Index (RSI). The March low created a bullish divergence that led to the 25+% rise and sent the indicator back to its prior most recent high. This is an area I’ll be watching going forward, waiting to see if momentum can breakout from this area of resistance.
In the bottom panel I’ve included the Average Directional Index indicator, which measures trend strength. As you can see, we also saw a lower high in this measurement as well – providing a clue that the down trend was losing some of its strength on that second leg lower.
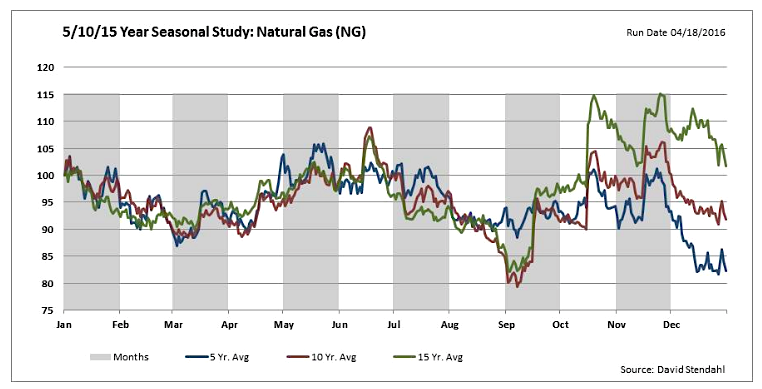
When reviewing commodities it can be a good idea to review seasonal charts as well, as many commodity trade in a seasonal pattern throughout the years. When looking for a market to break out or change trend, we’d prefer to not be fighting against an opposing seasonal direction. For Natural Gas, we can see in the chart below that the 5-, 10-, and 15-year seasonal studies show a low in March with price advancing until mid June. This lines up nicely with what we’ve seen play out so far this year.
As I said before, going forward I’ll be watching the 100-day Moving Average and the resistance in the RSI momentum indicator for clues to nat gas’s ability to continue its current trend higher. We also know that we may get a weather tailwind this summer which could also add some juice to the price trend in the coming months.
Thanks for reading.
The information contained in this article should not be construed as investment advice, research, or an offer to buy or sell securities. Everything written here is meant for educational and entertainment purposes only. I or my affiliates may hold positions in securities mentioned.
Further Reading From Andrew: GOLD: Is COT Report Data A Reason To Be Bearish?
Twitter: @AndrewThrasher
Read more from Andrew on his Blog.
Any opinions expressed herein are solely those of the author, and do not in any way represent the views or opinions of any other person or entity.


