Natural Gas Technical Analysis
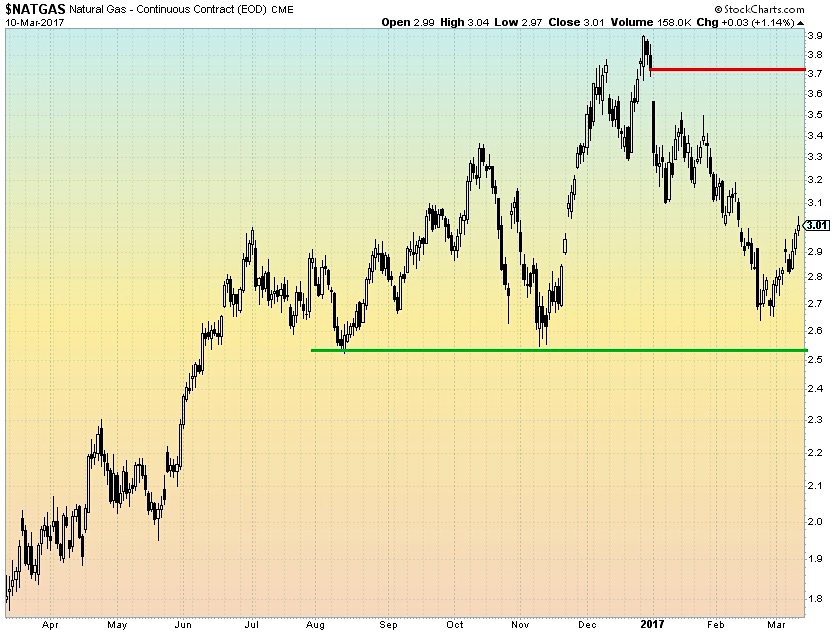
Prompt-month Natural Gas (NG) continues to find support between $2.50-$2.55. Is a rally now taking shape?
While not shown on the below chart, the now expired March contract dipped to this support area in late February immediately prior to the contract roll (from the March contract to the April contract). NG rallied from about $2.53 to above the $3 mark in anticipation of a late burst of cold weather this week across the eastern half of the country. Of course a technician is only concerned about where price is going, not fundamentally ‘why’.
Where could the price of NG go from here? There is an obvious roll gap to fill way up in the low $3.70s which may come in play in the coming months.
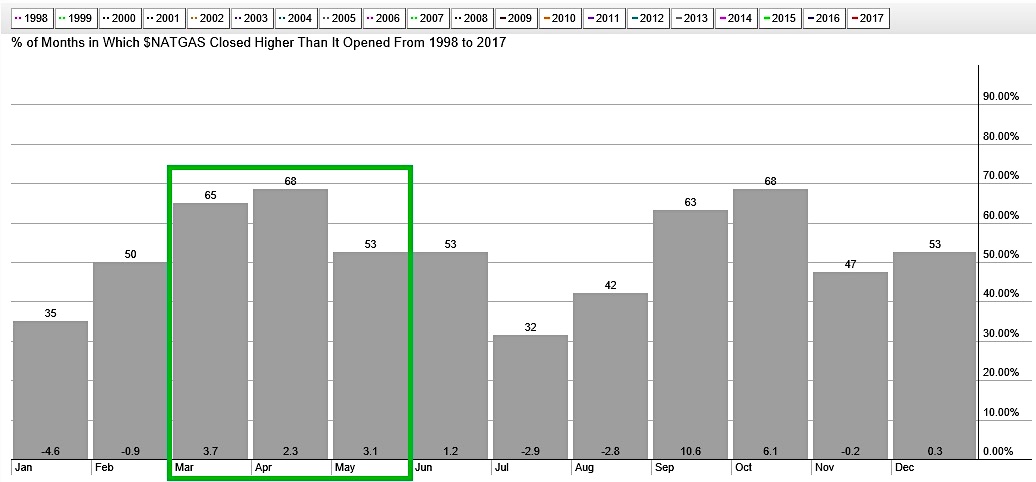
NG tends to follow a seasonal pattern in which it rallies during its low physical demand periods of the year known as the energy shoulder months. Shoulder months are generally the meteorological spring and fall (March-April-May, September-October-November).
Fundamental energy traders and analysts can often find this frustrating as intuition would suggest that the cold months of December-January-February would yield upside price risks from heating demand while the hot months of June-July-August would draw upside price risks from cooling demand. Not so. Going back 10 and 20 years, we see that NG rallies during the low physical demand spring and fall seasons and often struggles during the summer and winter. The below chart from Stockcharts.com shows the upcoming 3 months are historically bullish across the past 20 years.
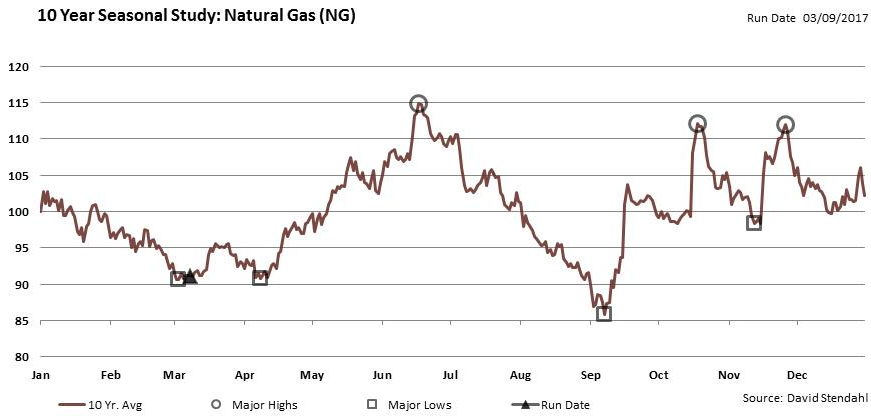
Another look at NG seasonality in more detail is from David Stendahl of Signal Trading Group. The 10-year typical day-by-day seasonality shows NG usually bottoms in early March and again in early April, but then rallies right up to the summer solstice in mid-late June.
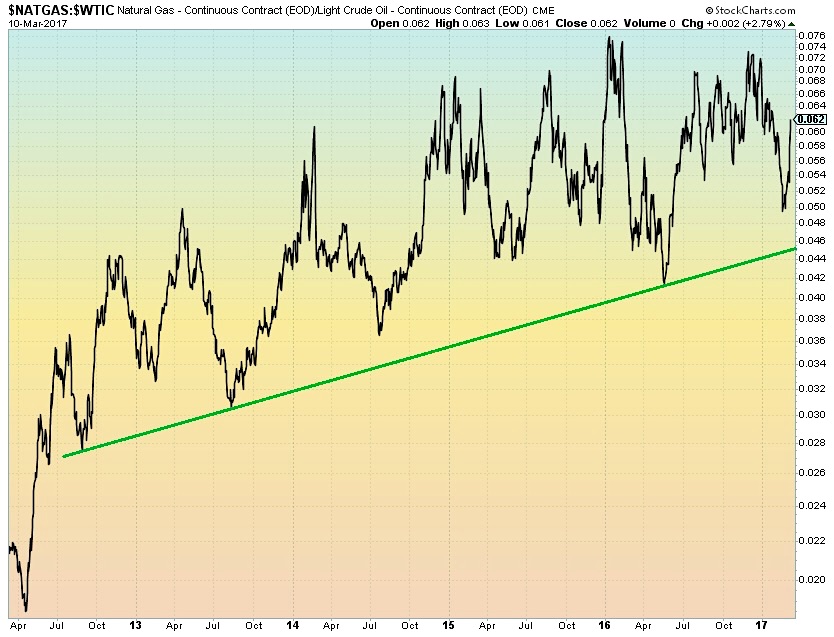
So we have a clear support zone between $2.50 and $2.55 on the chart of NG as well seasonality turning positive versus the prior bearish months. Another way to look at NG is on a relative basis versus Crude Oil. Much has been written recently about Crude Oil’s tumultuous drop from the mid-$50s to the upper $40s, all the while NG has been in rally mode. Taking a look at the relative chart of NG versus Crude Oil, we can see that NG held an important uptrend support line dating back several years. Perhaps the chart of NG vs Crude Oil takes a shot at the upper end of its uptrend channel, which it has done many times in the past several years.
While seasonality and relative strength are important indicators for any asset, price is our primary indicator. If NG breaks the $2.50 support point, it is all for naught and we likely see a heavy selling into the low $2s. Nevertheless, if the near-term price trend and longer-term relative strength trend versus Crude Oil continue, along with seasonality turning bullish for the next 3 months, NG may see significant upside into the high $3s.
Thanks for reading.
Twitter: @MikeZaccardi
Any opinions expressed herein are solely those of the author, and do not in any way represent the views or opinions of any other person or entity.

: Showing Some Signs of Emerging Strength")
