While several commodities rode strong buying waves to new highs in 2021, some commodities have really cooled off over the past several months.
One of them is Natural Gas. And this is our chart in focus today
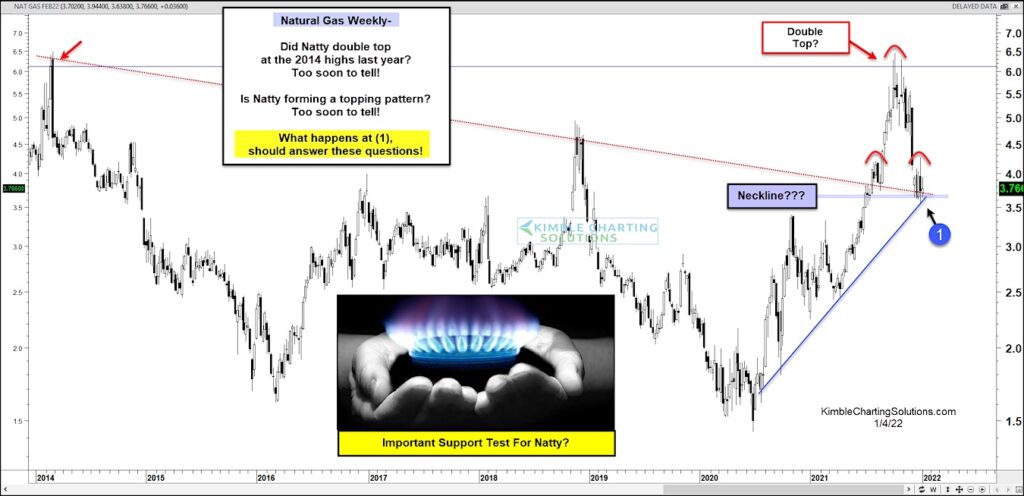
Looking at the “weekly” chart, you can see that Natty gas went from making new lows in 2020 to testing its 2014 highs! Now that is a big move. And a pullback was expected. But a strengthening dollar has added to the selling pressure and created concerns of a potential double top… that could turn head and shoulders.
In short, there is a lot going on here for Natural Gas. The decline is now testing prior downtrend support, neckline support, and uptrend support at (1).
Is a major top playing out? Or is Natty about to run higher once more. Keep an eye on this confluence of support. Stay tuned!
Natural Gas “weekly” Price Chart
Note that KimbleCharting is offering a 2 week Free trial to See It Market readers. Just send me an email to services@kimblechartingsolutions.com for details to get set up.
Twitter: @KimbleCharting
Any opinions expressed herein are solely those of the author, and do not in any way represent the views or opinions of any other person or entity.

: Showing Some Signs of Emerging Strength")
