Natural Gas prices are seeing rather dramatic volatility from one weather model run to another in recent weeks.
Rather than trying to figure out what each weather model says fundamentally about Natural Gas Futures, sometimes it is best to go straight to the charts and see what price action is saying. There are already two significant bearish candlestick formations on the weekly chart of NG this year.
Bearish Signals on Weekly Chart of Natural Gas – January 2017
To preface and as a refresher, a candlestick on a chart is created by taking the open, high, low and close of an asset for a given time period, in this case a weekly time interval on Natural Gas. We take the first print on Sunday night at 6pm when futures trading begins, then the final price is the last trade at 5pm Friday. A candlestick is known for its “shadows” and “real body”: the upper shadow is the range in which it traded above the opening and closing price; the lower shadow is where it traded below the opening and closing price. The real body is the area between the open and close. In the chart below, a green candlestick says the week closed above the open, while a red candlestick is when the close was below the open. Candlesticks give traders a good visual idea of the price action from period to period.
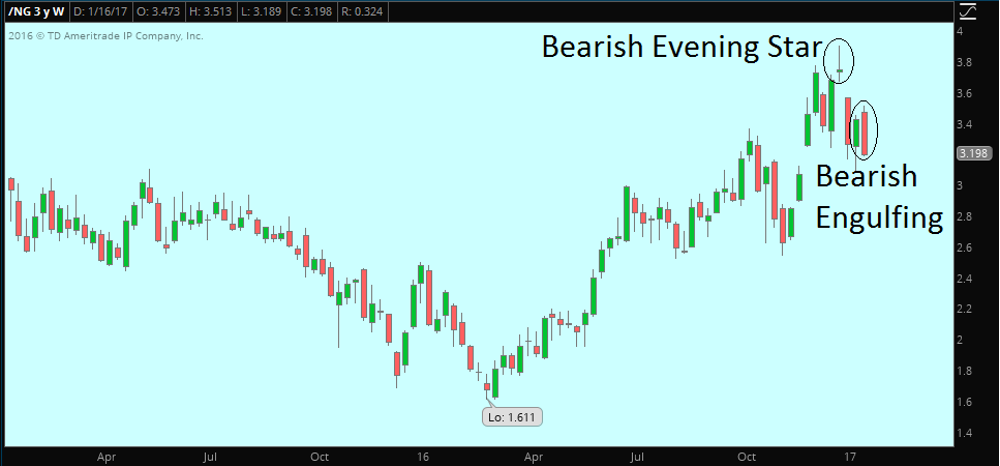
In the below chart we have a “bearish evening star” pattern from a few weeks ago. A bearish evening star is when there is a long green candlestick on week 1, followed by a gap up and a small green or red candlestick on week 2, then a gap down with a long red candlestick on week 3. This is a classic bearish formation.
Another bearish pattern just occurred: a “bearish engulfing” candlestick. This happens when a long red body of a candlestick engulfs the prior week’s sizable green body. This candlestick pattern is a bit more intuitive than the bearish evening start.
So NG has had 2 rather bearish weekly candlestick patterns already this year! Support would be found near $2.90-$3.00 which is trend line support from the $1.61 March 2016 bottom.
Natural Gas 2-year Weekly Chart: Bearish Candlestick Formations Notated
Thanks for reading.
Twitter: @MikeZaccardi
Any opinions expressed herein are solely those of the author, and do not in any way represent the views or opinions of any other person or entity.


 Flirting With Critical Support… Again")


