Things were looking up for natural gas at the beginning of the year.
But a big rally gave way to a big selloff.
Today, we look at the volatile U.S. Natural Gas ETF (UNG).
And, although its in a rough patch, perhaps the future brings hope… in the way of a large basing price pattern.
Note that the following MarketSurge charts are built with Investors Business Daily’s product suite.
I am an Investors Business Daily (IBD) partner and promote the use of their products. The entire platform offers a good mix of tools, education, and technical and fundamental data.
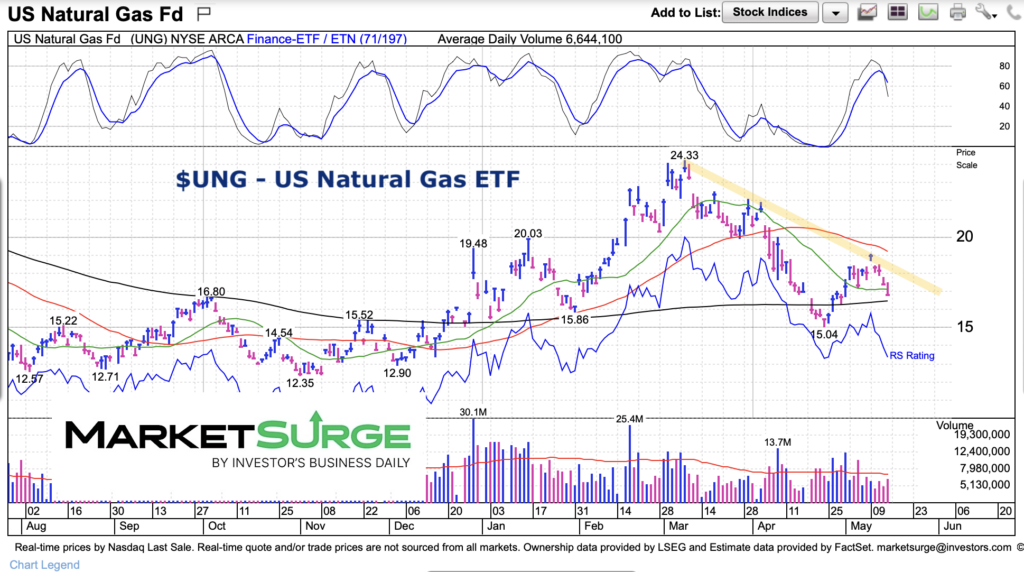
$UNG Natural Gas ETF “daily” Chart
Momentum has turned lower and downtrend resistance has held. Both are near-term setbacks for UNG. However, there is strong support at the $12-$13 area (a base was built). This should provide support, but as noted, natural gas can be quite volatile so risk management needs to be in full effect.

Twitter: @andrewnyquist
The author may have a position in mentioned securities at the time of publication. Any opinions expressed herein are solely those of the author, and do not in any way represent the views or opinions of any other person or entity.


