Over the past several weeks, I have dedicated a hefty sum of my time to looking at the rise in commodities (as it ties into today’s inflationary concerns).
Yes, they are tradable assets and my charts highlight turning points and breakouts / breakdowns.
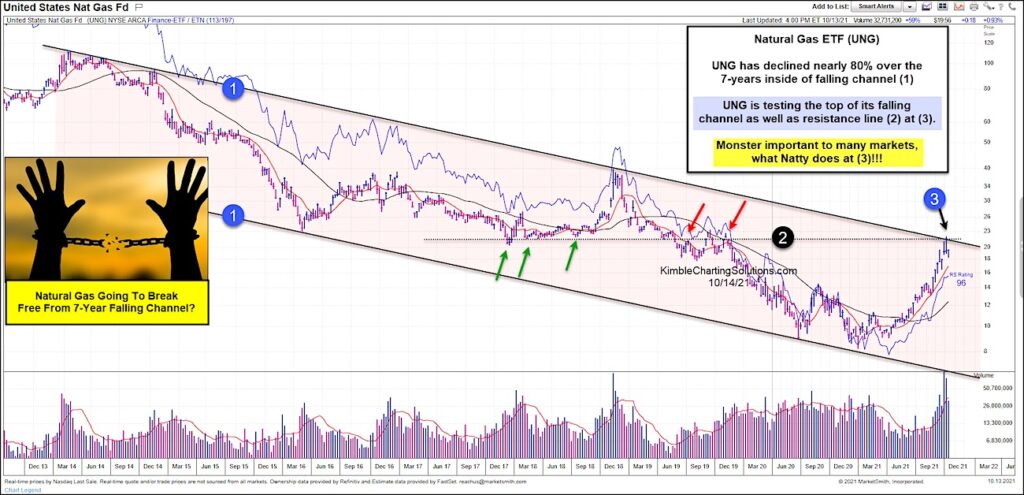
But when they serve a dual purpose, they are even more important. We look at this theme yet again today, highlighting an important inflection point for the US Natural Gas Fund ETF (UNG).
As you can see, UNG has declined nearly 80% while biding its time within a 7-year falling price channel marked by each (1). The recent run-up in energy commodity prices has pushed natural gas prices much higher… and this has helped to push UNG to multi-month highs. It is now testing the top of the falling price channel along with an old support/resistance line at (2) and (3).
This is a big spot for the Natty ETF UNG. If price breaks out above (3), it could be an expensive winter for many people! Stay tuned!
Note that KimbleCharting is offering a 2 week Free trial to See It Market readers. Just send me an email to services@kimblechartingsolutions.com for details to get set up.
Twitter: @KimbleCharting
Any opinions expressed herein are solely those of the author, and do not in any way represent the views or opinions of any other person or entity.


