A review of this year’s broad US stock index momentum leaders (such as the Dow Transports and Russell 2000) wouldn’t be complete without a look at NASDAQ Composite. At +28.25% YTD the COMPQ it isn’t the leader of the pack, but after closing above the 61.8% retracement (near 3600, i.e. 10% ago) of the Dot-Com high-to-low in September, it’s worth a look to see how the index’s protracting recovery is faring.
Stats like that in a year like that drop heavy hints that NASDAQ Composite momentum may be erring on the side of “too extended” in its current leg up – hints that are readily affirmed by the data.
To give an idea, here’s one monthly study on the tech-heavy index evaluating momentum by looking at its distance from key long-term moving averages, looking back over a period encompassing the historic bull run and bubble of the late Nineties. The top panel is the index itself; the middle panel the distance of the index from its 50-Month Simple Moving Average (50SMA); and the lower panel the distance of the index from its 200-Month Simple Moving Average (200SMA).
NASDAQ COMPOSITE (COMP) – Monthly: Spread from 50-Month and 200-Month SMAs
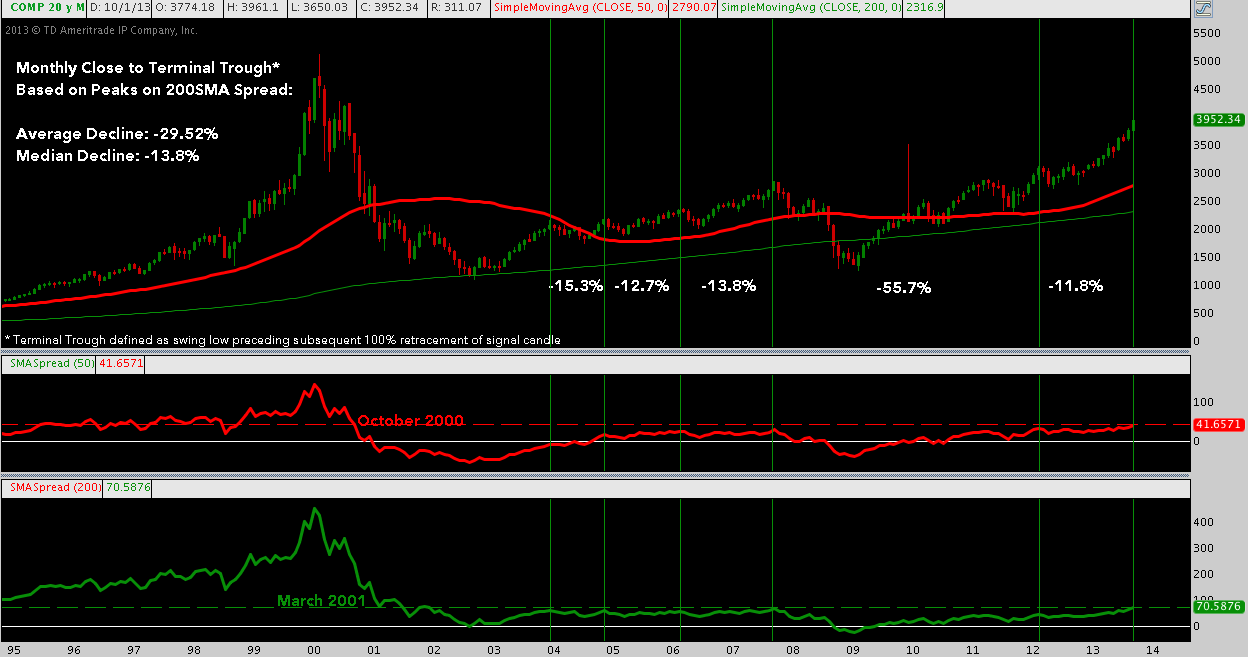
The COMPQ‘s spread from its 50SMA is above every extreme seen since October of 2000 (on the way down; on the way up, this level was last seen in Q4 1998 after the LTCM dip). The spread from the 200SMA is now above every extreme seen since March 2001(also on the way down; on the way up this level was last seen in the early Nineties).
Working from the 200SMA, there were comparable peaks at this level (~70) in 2003, 2004, 2006, and 2007. Including the 2012 peak (taken from the 50SMA Spread, being that indicator’s previous peak over the late 2007 high), these peaks have coincided with local tops giving way to corrections averaging -29.52% (-13.8% median).
Is it is 2003/2004/2006/2007/2012? Or is the irrepressible, infinitely-stretching Nasdaq momentum of late 1998 back? We’ll know soon enough.
Twitter: @andrewunknown and @seeitmarket
Author holds net short exposure to Russell 2000 at time of publication.
Any opinions expressed herein are solely those of the author, and do not in any way represent the views or opinions of any other person or entity.


