Nasdaq Composite Index “weekly” Price Chart
I am reviewing global stock market charts and data for our Technical Tuesday report to clients and wanted to share a “long” trading idea.
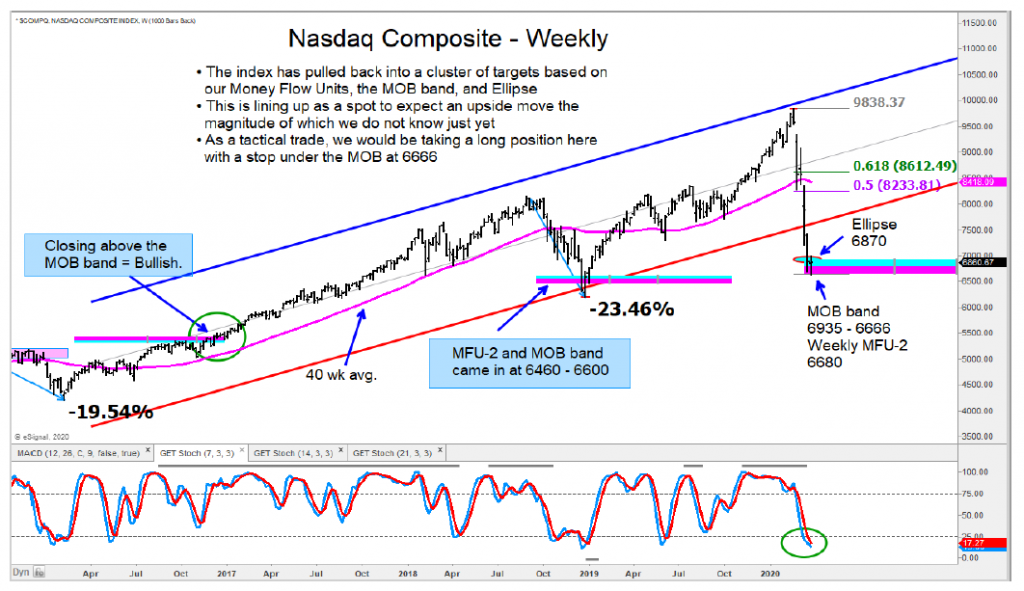
Here’s a “weekly” chart of the Nasdaq Composite.
The index tested down into its MFU-2 price target zone (based on the weekly time frame). The index also hit a MOB band of support and produced an Ellipse buy signal.
I believe the reward to risk zone for a long trade is favorable. I will use the recent low as a stop.
It’s a bit early for an upside target to get generated at this point, but I will share that once a move to the upside gets going. Note much of this will depend on your timeframe. Note as well that this is a tactical trade and I fully expect a retest at some point.
The author and or his firm has a “long” position in mentioned securities (Nasdaq Composite Index) at the time of publication. Any opinions expressed herein are solely those of the author, and do not in any way represent the views or opinions of any other person or entity.

: Worrisome to Broader Market?")


