As we often say, leaders lead the market both up and down.
This year it has been mostly down and, as usual, the market leader on the way up is leading on the way down.
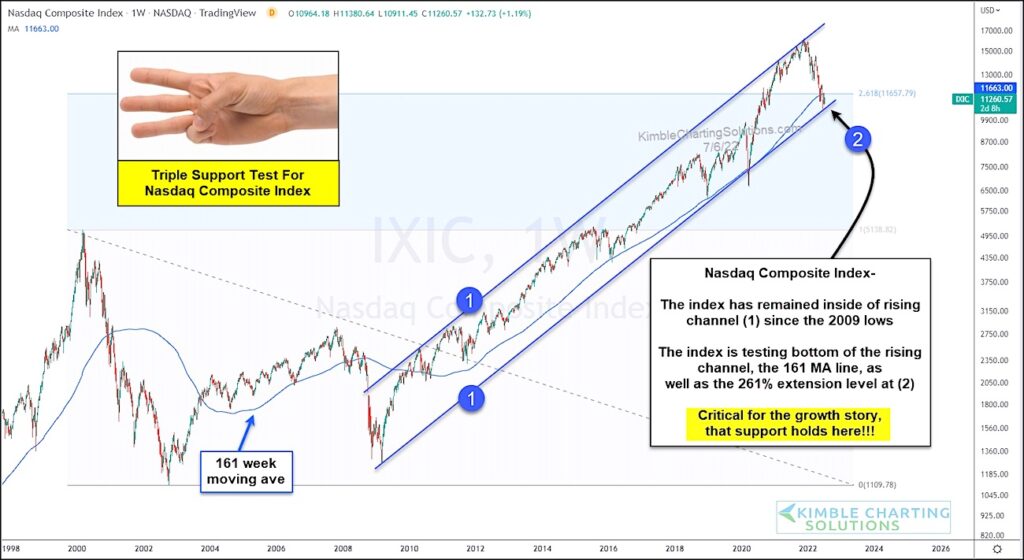
Today we provide an updated long-term chart of the Nasdaq Composite. As you can see, the Nasdaq has been in a rising up-trend channel marked by each (1) since 2009.
Currently, the tech index is testing the bottom of the rising channel, the 161-week moving average, as well as the 261% Fibonacci extension level at (2). Tech stocks are not only a market leader, but a strong representation of growth stocks and the global economy.
This seems like an important test of support for tech stocks! Stay tuned!
Nasdaq Composite Long-Term “weekly” Chart
Note that KimbleCharting is offering a 2 week Free trial to See It Market readers. Just send me an email to services@kimblechartingsolutions.com for details to get set up.
Twitter: @KimbleCharting
Any opinions expressed herein are solely those of the author, and do not in any way represent the views or opinions of any other person or entity.


