Large cap tech stocks have been a strong leadership force for the stock market for several years. Moreover, the Nasdaq 100 has outperformed the broader market, and more specifically the Russell 2000 in 2017.
Is that dynamic changing?
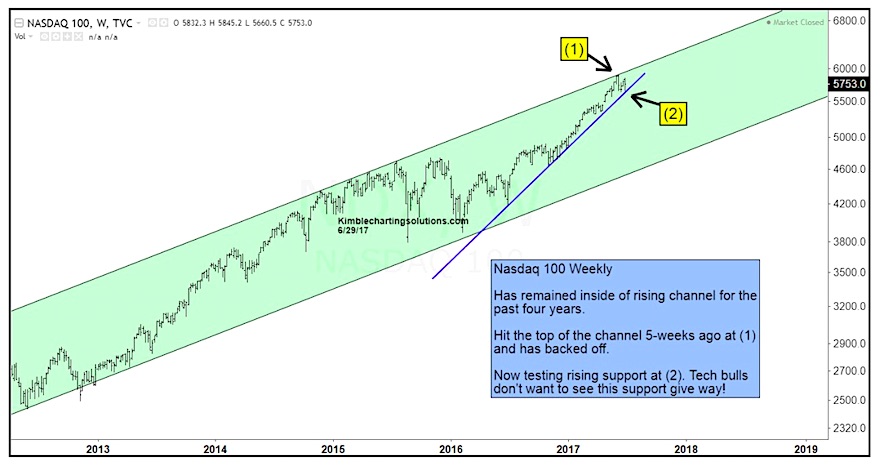
The chart below takes a closer look at large cap tech and the Nasdaq 100 since 2013. The NDX has seen momentum slow of late but the up-trend remains in place… for now. After testing the top of its rising channel at point (1) earlier this year, the Nasdaq 100 has pulled back to test its 2-year rising support trend line this week at point (2).
The NDX is getting squeezed between resistance and support. And whichever way price breaks will dictate the next big move. Clearly, Tech bulls would prefer that this trend line holds! Holding above this trend line would also keep tech firmly in its leadership role.
Nasdaq 100 (NDX) 5 Year Rising Trend Line Chart
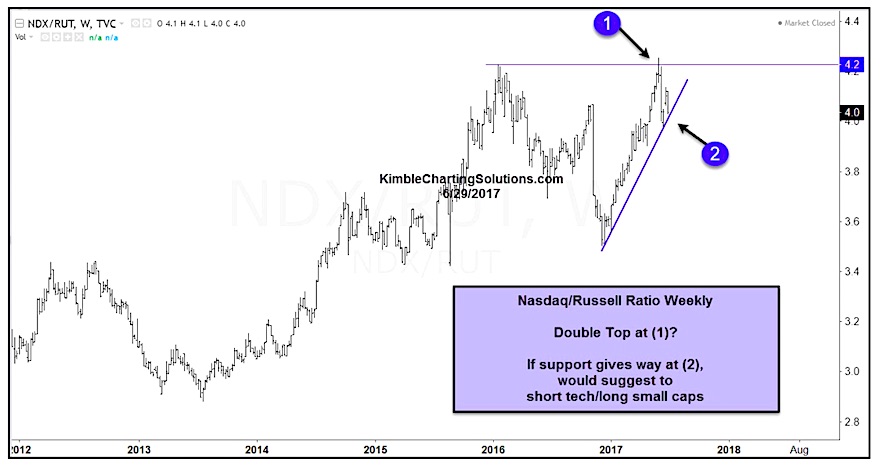
Large cap tech stocks have been stronger than small caps for some time, but he ratio (Nasdaq 100/Russell 2000) appears to be forming double top pattern at point (1). As well, rising support comes into play at point (2). If the ratio breaks support, it would send a message that the Russell 2000 may be ready to outperform the Nasdaq 100.
Thanks for reading.
Twitter: @KimbleCharting
Any opinions expressed herein are solely those of the author, and do not in any way represent the views or opinions of any other person or entity.


