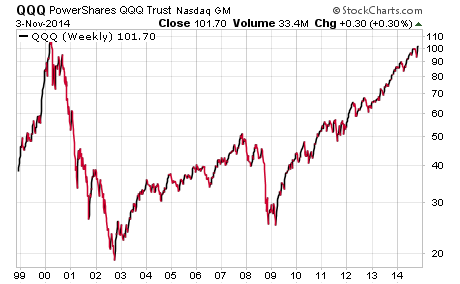
A new 14-year high in the NASDAQ 100 Index (NDX) is certainly something to celebrate for investors that have ridden the ups and downs of these tech growth stocks since the turn of the century.
Veteran traders will remember the exuberant sentiment that pushed the NASDAQ 100 to its bubble highs, only to watch it unwind in devastating fashion. Now, over a decade later, this technology-heavy index of stocks is in sight of its all-time highs and appears poised to reach that level based on its current trajectory.
Most investors access the NASDAQ 100 Index through the widely followed PowerShares QQQ Trust (QQQ). This exchange-traded fund (ETF) boasts total assets of over $40 billion and is comprised of the 100 largest domestic and international non-financial companies listed on the NASDAQ stock exchange. The index was conceived in March 1999 and continues to be one of the most heavily watched and traded ETFs along with the SPDR S&P 500 (SPY) and iShares Russell 2000 (IWM).
As a whole, QQQ has an overwhelming 60% slant towards the information technology sector. Apple Inc (AAPL), Microsoft Corp (MSFT), and Google Inc (GOOG) make up the top three holdings of this market-cap weighted ETF. AAPL in particular accounts for almost 14% of the fund.
Others categories of the ETF are split between consumer discretionary and healthcare sectors, which are largely dominated by cutting edge biotechnology names. What you won’t find in QQQ is any energy, financial, or utilities stocks.
It’s also interesting to note how QQQ has evolved over time to include new high growth companies. Many household names such as Facebook (FB) and Google (GOOGL) have only been available as public companies long after the debut of the original NASDAQ 100 Index. They have worked their way into this basket through sheer offering size and stock price velocity over time as the constituents are evaluated on a quarterly basis.
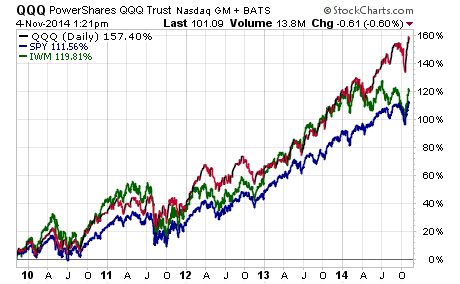
From a performance perspective, QQQ is the clear bull market leader over the past 5 years vs both SPY and IWM. The last 12 months in particular have shown a marked leap in relative strength as a result of a strong performance in technology and biotech stocks.
QQQ vs SPY vs IWM – 5 Year Chart
The lack of defensive sectors typically found in other broad-based indexes and ETFs has worked in the favor of QQQ over the past several years. However, this means means a more aggressive approach so investors should be more cautious as subsequent dips in the market may lead to this ETF accelerating faster to the downside than expected. With the expectation of greater gains comes the understanding of higher investment risks.
The bottom line is that the NASDAQ 100 (by way of the QQQ ETF) offers an excellent way to track large, growth-oriented companies in the technology arena through a low-cost investment vehicle. Total expenses to own QQQ on an annual basis are just 0.20%. This should certainly be a fund to monitor and consider for your portfolio if its underlying holdings and asset allocation suit your risk tolerance and time horizon. Thanks for reading.
Get more insights from Dave’s FMD Capital Website.
Follow Dave on Twitter: @fabiancapital
No position in any of the securities mentioned at the time of publication. Any opinions expressed herein are solely those of the author, and do not in any way represent the views or opinions of any other person or entity.

: Worrisome to Broader Market?")

