Stock market bulls faced some turbulence this week as fears quickly arose over growing coronavirus fears.
Or at least that’s the catalyst / excuse…
In reality, the stock market has been red-hot and is overdue for some corrective activity. While the past 2 days of selling may be all we get, investors have to remain focused on price, trends, and the disciplined rules that each of us have set for ourselves.
Today, I once again shed a light on tech stocks and the Nasdaq 100 Index. 3 of my past 4 articles have focused on the Nasdaq, and for good reason. Technology stocks have been the leader. As active investors we want to invest in leaders, but also follow leaders as market indicators. It’s important to take note when leaders begin to show weakness. It’s still early, but I’ll highlight an important pattern to follow this week.
Note that the following MarketSmith charts are built with Investors Business Daily’s product suite.
I am an Investors Business Daily (IBD) partner and promote the use of their products. The entire platform offers a good mix of technical and fundamental data and education.
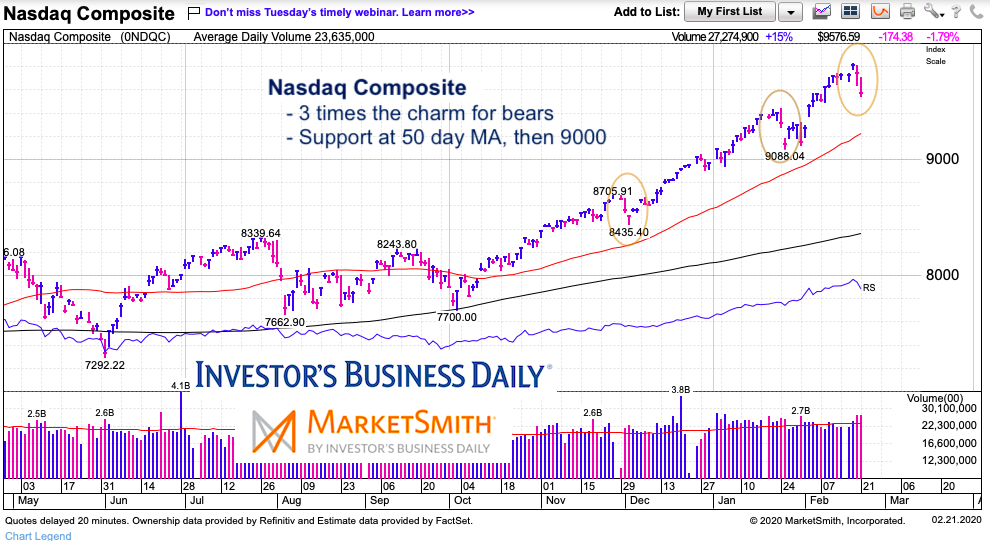
Nasdaq 100 Chart
As you can see, this large cap tech index has been very strong and trending higher. However, the recent 2-day pullback looks very similar to the past 2 pullbacks (circled). Will the market continue it’s pattern of buying the 2-day dip, or will it be different this time.
Much will be decided this week. Should we see more selling, look for initial support at the 50-day moving average, then the 9000 area.
Twitter: @andrewnyquist
The author may have a position in mentioned securities at the time of publication. Any opinions expressed herein are solely those of the author, and do not in any way represent the views or opinions of any other person or entity.


