Tech stocks have been the backbone of the decade long bull market as our economy continues to become more tech and service oriented.
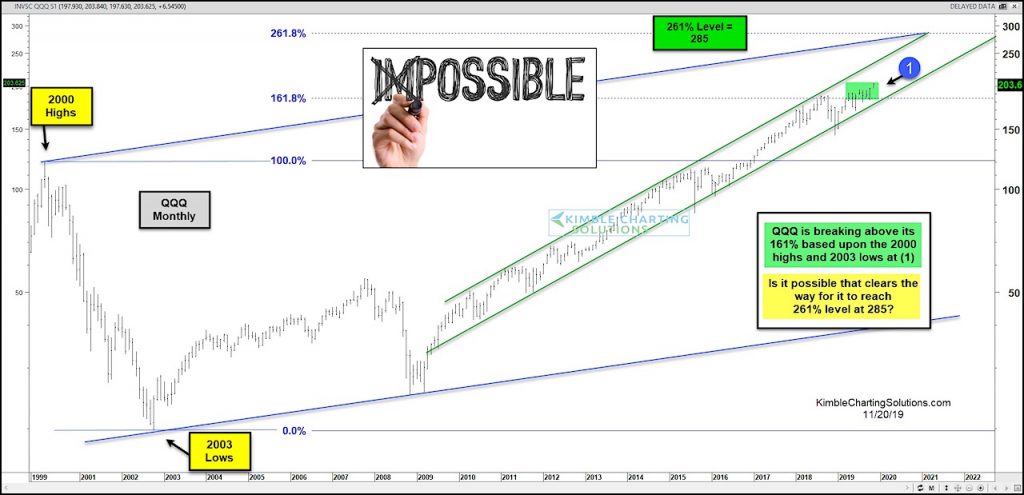
We can see this in today’s chart, which features a long-term “monthly” view of the Nasdaq 100 ETF, the PowerShares QQQ Trust (QQQ).
Note that this ETF is comprised of Large Cap tech stocks, including Apple (AAPL), Google (GOOGL), Facebook (FB), and Intel (INTC), to name a few.
As you can see, the QQQ’s remains inside of two long-term rising channels. The narrowest of the two (in green) shows the Nasdaq 100 ETF breaking out above its 161.8% Fibonacci extension level (of the 2000 highs/2003 lows) at point (1).
This move is long-term bullish and opens up the possibility of higher prices.
How high? The $QQQ’s are now free to work towards its 261.8% Fibonacci price level at 285. Watch for a strong volume up move to confirm. Only a move below the lower green rising trend support would be bearish. Stay tuned!
$QQQ Nasdaq 100 ETF “Monthly” Chart
Note that KimbleCharting is offering a 2 week Free trial to See It Market readers. Just send me an email to services@kimblechartingsolutions.com for details to get set up.
Twitter: @KimbleCharting
Any opinions expressed herein are solely those of the author, and do not in any way represent the views or opinions of any other person or entity.


