Inflation Manipulation
There is a bigger and more nefarious problem with inflation measurements and how they can be manipulated. To reiterate, MMT states that government spending and money printing can occur as long as inflation is limited.
If inflation regulates government spending and by default the health of the economy, then won’t leaders, who will do anything to retain their power, suppress inflation readings to allow greater spending?
Sadly, that question is rhetorical. We know the rate of inflation is already being suppressed for political reasons. As an example, the Federal Reserve uses Core CPI, a derivative of CPI that excludes food and energy, as prices on those two components are unusually volatile. They do tend to be volatile, but they are also two of the biggest expenses of the population. That is like measuring a quarterback’s accuracy without considering passes that occur further than ten yards from the line of scrimmage.
As for the government, they routinely take steps to manipulate how CPI and other inflation data are calculated and published.
Before continuing with what some may call a conspiracy theory, we think a little background on the Boskin Commission is appropriate. Per Wikipedia:
The Boskin Commission, formally called the “Advisory Commission to Study the Consumer Price Index”, was appointed by the United States Senatein 1995 to study possible bias in the computation of the Consumer Price Index(CPI), which is used to measure inflationin the United States. Its final report, titled “Toward A More Accurate Measure Of The Cost Of Living” and issued on December 4, 1996, concluded that the CPI overstated inflation by about 1.1 percentage points per year in 1996 and about 1.3 percentage points prior to 1996.
The report was important because inflation, as calculated by the Bureau of Labor Statistics, is used to indexthe annual payment increases in Social Securityand other retirement and compensation programs. This implied that the federal budget had increased by more than it should have, and that projections of future budget deficitswere too large. The original report calculated that the overstatement of inflation would add $148 billion to the deficit and $691 billion to the national debt by 2006.
The Boskin Commission was formed, and their recommendations enacted, to reduce reported inflation. Inflation is costly to the government due to higher borrowing rates, cost of living wage adjustments, and social security expenses. Said differently, by lowering measured inflation they reduced governmental expenses and allowed for more spending. Our opinion on the government’s motives is not a result of our cynical nature; it is based on the illogic of some of the adjustments that have occurred since the commission was formed.
The best example to highlight this is housing prices and their contribution to CPI. In 1998, the Bureau of Labor Statistics (BLS) changed the way they calculated real estate prices within CPI. The BLS replaced an index based on actual home prices with what is now called owner’s equivalent rent (OER). OER is a rental equivalence which calculates the price at which an owned house would rent. It is important to note that rents were then and continue to be a part of the CPI calculation.
The graph below compares the compounded growth rates of the OER index and the widely recognized leader in home price indexing, Case-Shiller U.S. National Home Price Index.
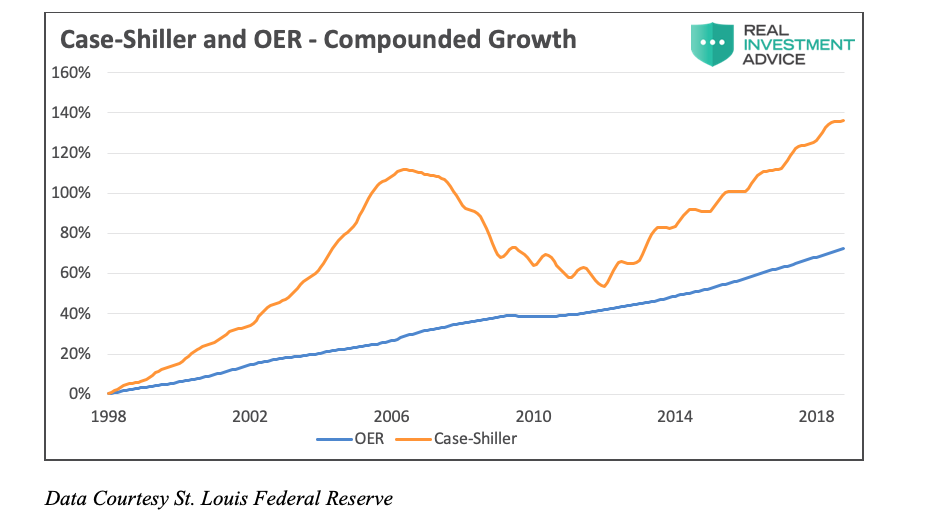
It is clear from the graph that OER is a great substitute for actual home prices if the goal is to reduce reported inflation. However, if you are a citizen and in the market for a house, OER represents wishful thinking.
Based on the data above, CPI has been suppressed by an average of 0.40% per year since 1998 due to the OER calculation. That may not seem material, but this one modification accounts for 20% of the CPI growth over the period.
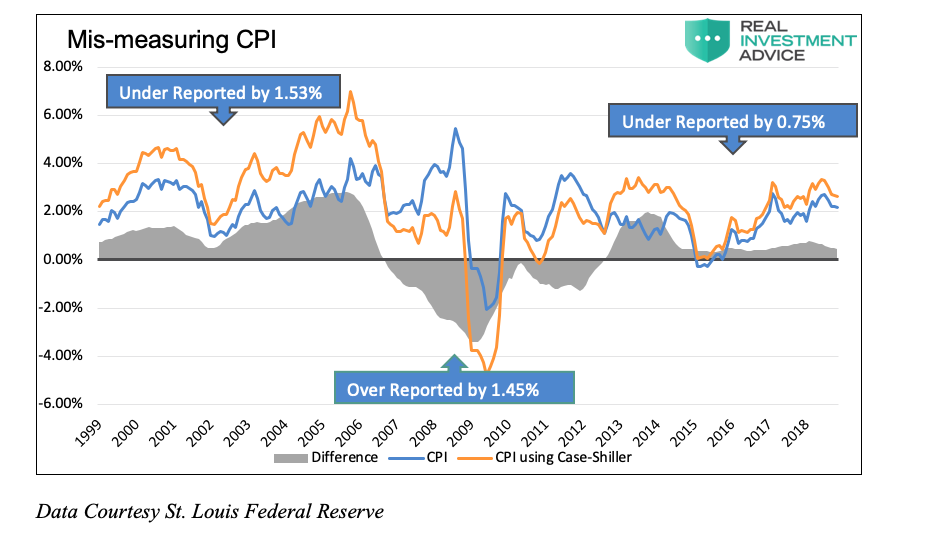
Even more concerning, the graph below shows that OER understates CPI by much more than 0.40% when the decline in house prices during the financial crisis is excluded. Since the crisis, OER has underestimated CPI by 0.75% annually, meaning that a truer inflation rate over the period from 2010 to current was 2.37% not 1.62%. Annual compounding implies CPI understated the rate of inflation by approximately 7%.
To put a final point on MMT and home prices, consider the following: If house prices in California are rising rapidly while falling in New York, should the same fiscal and monetary policy be applied to both situations? MMT would benefit both New York and California but is that what is truly best for Californians, a state notorious for pricing many out of the housing market? In either case, those most severely impacted are the lower and middle classes struggling to maintain their standard of living.
Summary
The problems described above are symptomatic. In this article we only touched on a few of the flaws with the government’s preferred inflation calculation and how it is being manipulated. There are a plethora of other adjustments that are made to adjust inflation to accommodate the preferences of policy-makers. Given the relative ease with which inflation can be hidden, we should assume politicians, especially those that embrace MMT, will lobby for more “adjustments” when inflation rises and threatens their campaign promises. Those promises are, after all, the basis upon which they assume power.
Twitter: @michaellebowitz
Any opinions expressed herein are solely those of the author, and do not in any way represent the views or opinions of any other person or entity.

 Flirting With Critical Support… Again")


