The following was written by the Richardson GMP Asset Management Team.
We have just passed the half way mark for 2016, and it has been a year of surprises.
2016 Financial Markets Review – Expect The Unexpected
On January 1st the U.S. 10-Year Treasury (INDEXCBOE:TNX) had a yield of 2.25%, today it is at a historic low of 1.37%. The Federal Reserve had just raised rates in December for the first time since 2006, as market participants waited to see the impact of this change in direction. The Canadian dollar was 72 cents and about to embark on a six-month roller coaster ride that would see a low of 68 cents and a high of 80 cents. China stumbled and then unleashed a credit expansion not seen since 2009. England voted to leave the EU. There was chatter of a U.S. recession and chatter the Fed had reacted too slowly, given U.S. economic strength. Much like Big Brother (we all have our vices), the rule in 2016 has been to expect the unexpected in financial markets.
Major Markets
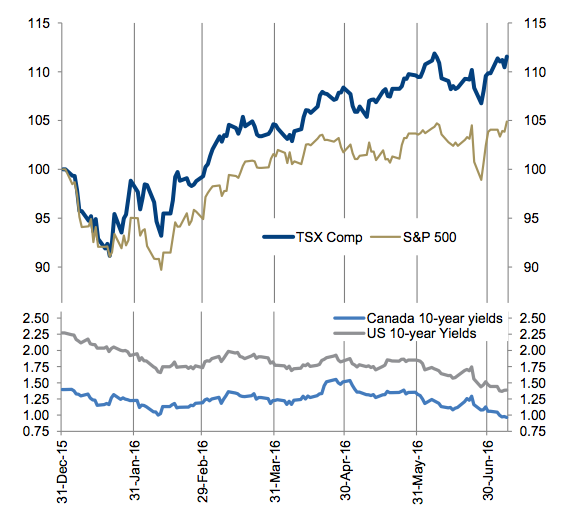
Finally, after five consecutive years of watching the Canadian equity market significantly underperform the U.S. market, we have sprinted out to a decent lead this year. Including dividends, the TSX is up over 10% while the S&P 500 Index (INDEXSP:.INX) is up about half as much. This lead is even bigger if you include the currency move, which has dragged down U.S. denominated performance by 5%. It has actually been a very good year for Canadian investors as our indices have lead most global markets. Europe is down 13%, with Asia down even more due to China and the Nikkei’s 20% drop.
The bigger story has been in the bond markets. Soft economic data pushed yields lower early in 2016. While the data improved, helping equity markets, the Brexit vote has spurred a flight to safe haven assets and the popularizing view that more global quantitative easing (QE) will keep yields lower for longer forever. Canadian 10-year yields are now 1% while 10-year yields are negative in Germany,
Switzerland and Japan. Very interesting times.
In a few years, most economic text books will have new chapters covering excessive use of QE and negative interest rates. Of course, you could write the chapters now but we simply don’t know how it will all work out. The only thing we can say with confidence is it will be a surprise; let’s hope it is a good one.
The Economy
Q1 certainly had some soft economic data, not just in North America but globally. Very weak data out of China and other developing economies weighed on commodity prices. However, in China, credit expansion in the many billions helped inflate asset prices and improve the economic backdrop. Meanwhile, a very weak Q1 in the U.S. of 1.1% didn’t help but this too is improving. The current forecasts for Q2 GDP in the U.S. sit at 2.4%, which would be the best pace in a year. The Citigroup Economic Surprise Index gives a good proxy for the global economy and isn’t as backward looking as GDP data. As you can see from the top chart, Q1 was certainly weak across the major regions while Q2 was much better. Early July is also seeing more improvement, notably from the U.S.
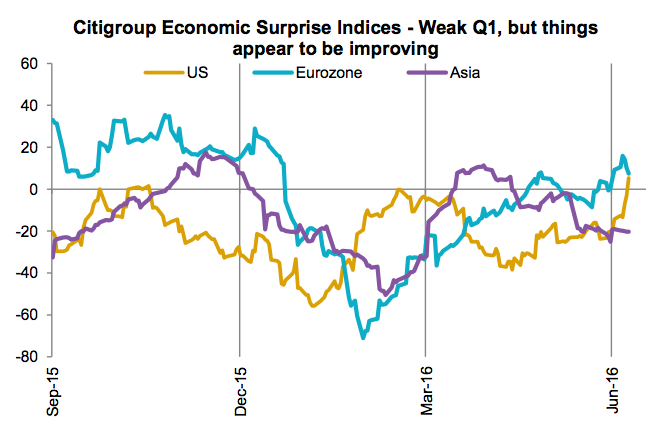
Overall, the global economy isn’t doing badly as 2016 is lining up for another year in the 3-4% growth range. Which does raise the observation that bond yields have less to do with economics and more to do with monetary policy measures, investors’ demand for safe haven assets and a lack of supply. The rapid rise in gold prices this year would be more evidence of this renewed demand for safe havens.
Digging Deeper in Equities
Think about it, the German government can issue a 10-year bond at 101 euro, pay no coupons and repay the investor in 2026 at 100 euro. They could build a toll bridge. As long as the IRR is 0% or better it is a good endeavour. This of course raises the risk that capital is not being allocated efficiently, something we may already be seeing in the equity markets.
Two groups have really shined so far in 2016. One was the two sectors left for dead in January / February, namely Energy (+19%) and Materials (+60%).
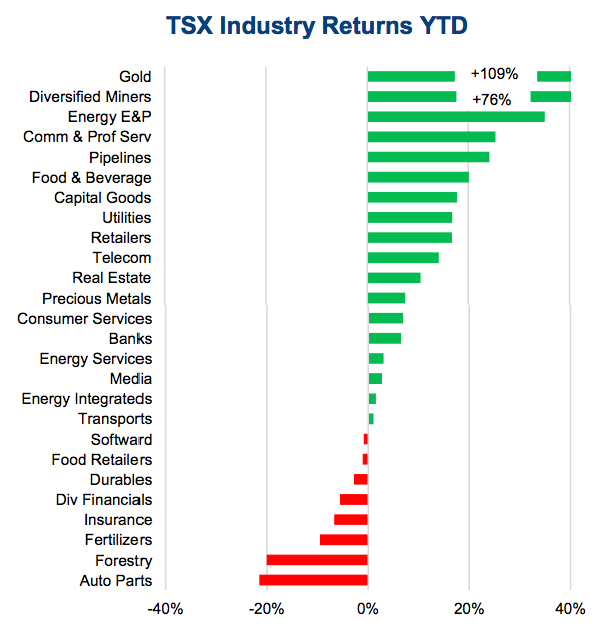
The energy sector lost 50% of its value from mid-2014 through early 2016 as the price of oil declined. Not to be outdone, Materials has lost 66% of their value over the past five years. Things have improved for both sectors as oil is getting closer to an equilibrium and supply disruptions have helped. China’s reflation move has helped lift commodities off the mat, helping the materials sector, as has the renewed demand for gold. Gold and Diversified Miners are the two best sub-industries so far this year (chart).
The other group to benefit has been the sectors that are most interest rate sensitive. As bond yields plummeted, these sectors soared. Utilities (+17%) and Telecom (+14%) are the 3rd and 4th best performing sectors. Care to guess which four sectors are the most expensive on a valuation basis? Yes, Energy (57x), Materials (33x), Utilities (21x) and Telcos (17x). Sure Energy and Materials have low earnings but these could come back quickly. Utilities and Telcos have limited to no growth and very stable earnings, meaning they are simply expensive because bond yields are low.
Summary
It has been a very interesting first half with lots of surprises. Super low yields, unlimited demand for safety, meanwhile the S&P 500 Index just made a new all-time highs moments ago. Living in interesting times is a blessing, investing in interesting times not so much.
Read more at Richardson GMP. Thanks for reading.
Charts are sourced to Bloomberg unless otherwise noted.
Twitter: @sobata416 @ConnectedWealth
Any opinions expressed herein are solely those of the authors, and do not in any way represent the views or opinions of any other person or entity.


