Since all investment decisions involve opportunity costs, comparing alternatives head-to-head can help with the development of a short list of buy candidates. At the end of the day, we all have limited capital so this theme is paramount to investor outperformance. With this in mind, I want to take a closer look at the Materials Sector and highlight why it still isn’t ranking high on my sector list.
iShares Materials Sector (IYM) vs. S&P 500
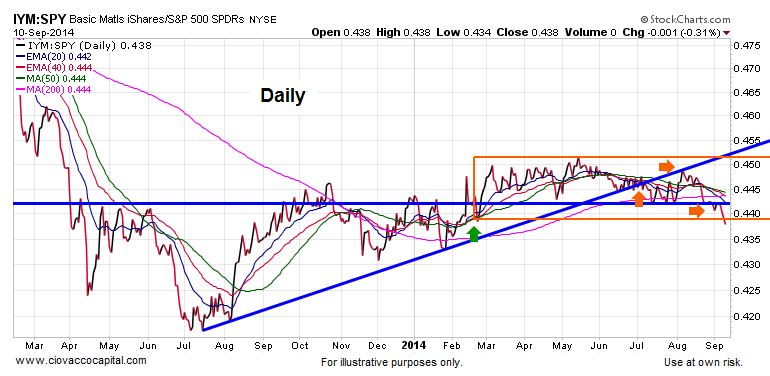
The chart below shows the performance of Materials (IYM) relative to the S&P 500 (SPY). When the ratio is falling, as it is now, it tells us the Materials Sector is underperforming. The ratio continues to make a series of lower highs and lower lows, meaning from an “odds perspective” we prefer to own the S&P 500 over the Materials Sector in isolation.
IYM:SPY Daily Chart
Weekly Look
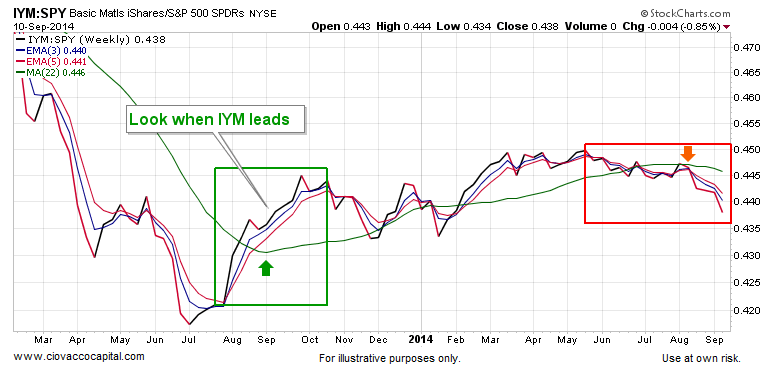
The weekly chart of the materials-to-S&P-500 ratio below allows us to compare a “bullish look” for IYM/SPY (see green box) to a “bearish look” for IYM/SPY (see red box).
IYM:SPY Weekly Chart
No Predictions Needed
If the charts morph back into the early stages of a trend that begins to favor the Materials Sector, we will be happy to consider IYM as well as the Materials Select Sector (XLB). That may happen soon, but the evidence has not turned yet. Therefore, we will stay away until the sector proves itself. Thanks for reading.
Follow Chris on Twitter: @CiovaccoCapital
Author holds a position in SPY at the time of publication. Any opinions expressed herein are solely those of the author, and do not in any way represent the views or opinions of any other person or entity.


