 By Andrew Nyquist
Hey peeps, happy Friday from the Sunshine State. My wife and I are enjoying some quality family time, and no doubt, our “tinies” are enjoying the beach and the sun to the fullest. Have to say, it’s been refreshing to be able to (mostly) tune out the markets and the noise. That said, I’ll keep this update on point and somewhat short.
The past two weeks remind me of the market action around the “Fiscal Cliff” at year-end. Lots of noise, lots of politics, and lots of emotion. All natural, but all potentially detrimental to your investing/trading health. Trust me, I CARE about our nation and desperately want our leaders to take steps to deal with our imbalances now… what’s happening in the Western world with sovereign debts is truly scary stuff. But, I also trade what’s in front of me. Price. And it is with this in mind that I have learned to focus on technical and psychological price points to determine where the market is going.
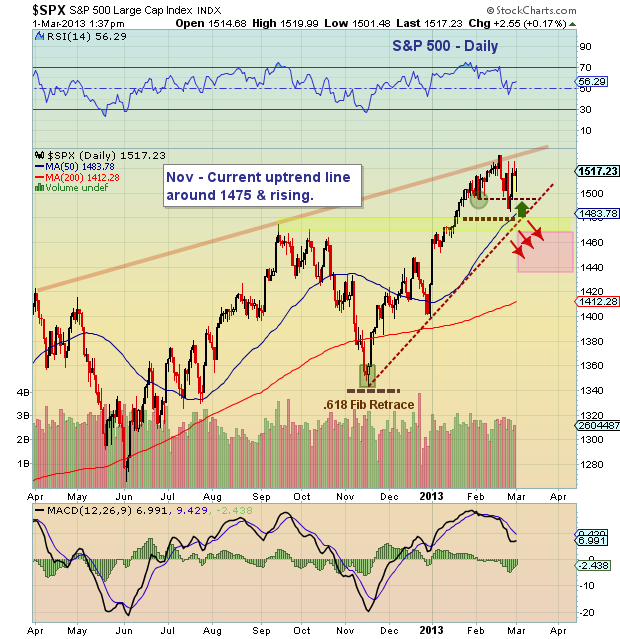
A quick and dirty look at the S&P 500 daily chart focuses our attention on a few important macro support levels: 1) The November to current uptrend line around 1475 and rising 2) The 50 Day Moving Average around 1483 3) The .382 Fibonacci retracement of the Dec 31 to Feb 19 move/wave around 1480.
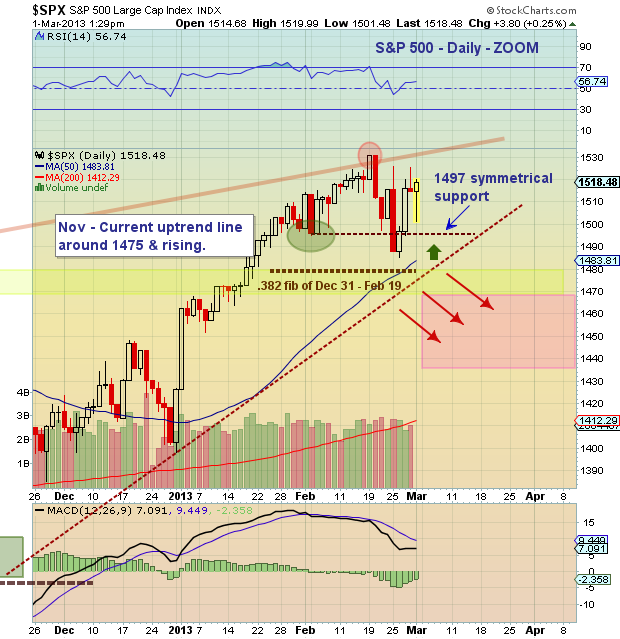
But to find out if any of these support will matter/come into play, we need to “zoom” in on the short-term chart (the second chart down). Here you can see the importance of 1497 as symmetrical support. The price action today came close (1501), which may be good enough for a “test.” Either way, I am watching that level. Should that give way, look for the above-mentioned confluence of macro supports to come into play around 1480. There’s really not a lot of nearby support below that level over than a September/October closing cluster around 1460.
On the upside, I’m watching the highs from Monday/Thursday around 1525. If the market can overtake this level, then new highs are likely. I would then put 1549 and March 15th on the radar; this intersection of time and price is at the higher end of my target topping range that came out of my in-depth VIX Reversal Analysis. Happy trading.
S&P 500 ZOOM Chart
Twitter: @andrewnyquist and @seeitmarket
No position in any of the mentioned securities at the time of publication.
Any opinions expressed herein are solely those of the author, and do not in any way represent the views or opinions of any other person or entity.
: Worrisome to Broader Market?")

: Important Breakout Retest")
