 By Andrew Nyquist
Heading into the New Year, the pessimism was palpable. The bears were expecting a fiscal cliff nightmare and were ready to run the S&P 500 out of town. On Friday December 28, the markets closed lower, the Volatility Index (VIX) juiced higher, and to add fear to the fearful, the S&P 500 futures swooned deeper post-closing. But on Monday, much to the bears chagrin, word of a Fiscal Cliff deal began to buzz, causing a VIX reversal lower and an equities ramp higher.
The markets continued to float higher over the ensuing days, with the S&P 500 reaching new multi-year highs this past Friday. The current price action has stirred plenty of bullish and bearish equities commentary, but much like politics, it is party affiliated (bulls vs bears). Although difficult, I try to simply share ideas, internal indicators, and key technical support and resistance levels that traders and investors should be aware of. And one such indicator that I like to monitor is the VIX. And it is the recent debate over the VIX reversal to new 5 year lows that has caught my attention.
On Saturday, I found myself asking a lot of internal questions. The crux of the my internal monologue went like this: Is the new VIX low a sign of complacency and a nearing short to intermediate term top? Or is it simply signaling stability and clarity?
As I began to analyze and compare the VIX to the S&P 500 price action, I realized that the one component of interest to me was the VIX reversal to new lows, as it highlighted a swift change in market sentiment. I really wanted to know how this swift change would continue to affect the equity markets? And more importantly, how soon thereafter did the equity markets experience a short to intermediate term top. With this in mind, I set the following criteria and began a case study:
1. The S&P 500 had to be in a macro uptrend (cyclical bull).
2. The S&P 500 had to be experiencing a pullback with an elevated VIX.
3. The subsequent VIX reversal had to be swift and bring about new lows.
See charts below with highlighted periods that met my criteria:
Volatility Index (VIX) 10 Year Chart:

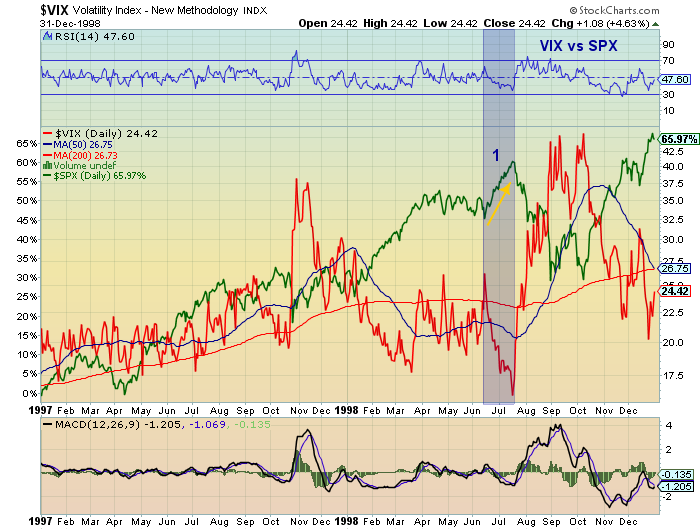
Volatility Index (VIX) 1998 Chart:
The VIX reversal to new lows analysis produced some interesting results. Especially when the outliers were removed (more on this later).
Analysis 1: VIX reversal on June 15, 1998 (from 26.20 to as low as 16.23)
- S&P 500 lows on June 16, 1998: 1074.67
- S&P 500 highs on July 20: 1190.58 (+10.79%) 5 weeks until topping range
- Ensuing pullback to 1998 lows: September 1, 1998 939.98 (-21.05%)*
Analysis 2: VIX reversal on May 13, 2005 (from 17.70 to as low as 9.88)
- S&P 500 lows on May 13, 2005: 1146.18
- S&P 500 highs on August 3rd: 1245.86 (+8.70%) 10 weeks until topping range
- Ensuing pullback to October 13, 2005 lows: 1168.20 (-6.23%)
Analysis 3: VIX reversal on February 5, 2010 (from 29.22 to as low as 15.23)
- S&P 500 lows on February 5, 2010: 1044.50
- S&P 500 highs on April 26, 2010: 1219.80 (+16.80%)* 10 weeks until topping range
- Ensuing pullback to July 1, 2010 lows: 1010.91 (-17.10%)*
Analysis 4: VIX reversal on March 16, 2011 (from 31.28 to as low as 14.30)
- S&P 500 lows on March 16, 2011: 1249.05
- S&P 500 highs on May 2, 2011: 1370.58 (+9.73%) 7 weeks until topping range
- Ensuing pullback to June 16, 2011 lows: 1258.07 -8.21%
After reviewing the data sets, I decided to eliminate larger than normal outlier % price movement data from VIX reversal analyses 1 and 3. I then calculated a midpoint for % price increases and near-term top timing to come up with the following:
Analysis 5 (THE CURRENT SET-UP): VIX reversal on December 31, 2012 (from 22.72 to as low as 12.29, thus far)
- S&P 500 lows on December 31, 2012: 1398.11
- S&P 500 projected highs: 1534.29 (+9.74%, midpoint of +8.70% to +10.79%)
- Timing: February 22nd (midpoint of February 5 – March 15)
The analysis is not without flaws, so take from it what you will. But here are my 2 key takeaways:
1) The common data points lead me to believe that we are likely nearing a short to intermediate term momentum trading top.
2) The subsequent price drops after each of the ensuing highs were nearly as great, or greater than, the entire preceding moves higher.
Trade safe, trade disciplined.
Twitter: @andrewnyquist and @seeitmarket
No position in any of the securities mentioned at the time of publication.


