The popular averages broke out of a seven-week trading pattern last week carrying many stock market indices to new record highs. The climb to new high ground was broad based with the NYSE Composite Index of more than 2000 companies hitting a new high for the first time since 2015.
The highlight of the week was the Dow Jones Industrials (INDEXDJX:.DJI) overcoming 20000. The significance in overcoming the new round number is primarily psychological. But the history of this achievement, per Ned Davis Research, is that the Dow Jones Industrials tend to outperform for up to a year following such an event.
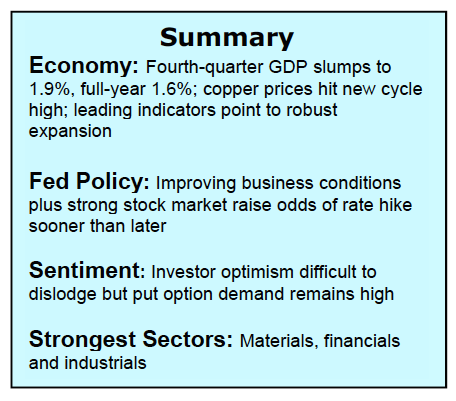
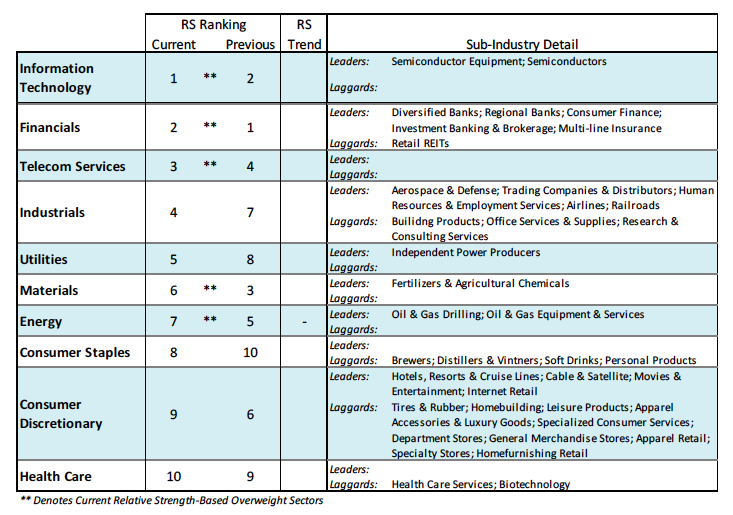
Support for restarting the rally is a new-found optimism over the fate of the economy and improving corporate earnings. The back-to-back expansion in profit growth and the prospects for tax and regulatory relief are considered a prerequisite in overcoming the historically high valuation levels that have anchored stocks since 2014. The sectors that continue to exhibit the strongest relative strength include the financials, industrials and technology. Materials jumped to number-one in relative strength among the 10 S&P 500 sectors and was the best-performing sector last week (+3.4%) and carried the averages to new highs. This is significant given that the trend in commodity prices often is a reliable indicator of the strength of the global economy.
The technical indicators for the stock market improved into last week’s gains that averaged about 1.00% for the Dow Jones Industrials and S&P 500 (INDEXSP:.INX). Trend and momentum are improved short-term and looking bullish longer-term. Stock market breadth was also a positive with the NYSE advance/decline line reaching a new record high. Additionally, the number of issues hitting new 52-week highs was the best since the December 9 peak.
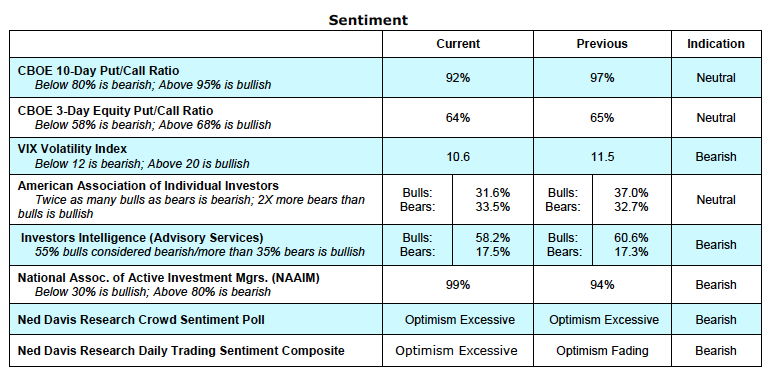
Investor sentiment remains problematic but the bubbly enthusiasm for stocks seen in the late 1990s is absent in the present example. This is seen in the most recent survey from the American Association of Individual Investors (AAII). The latest AAII data show more bears than bulls, which is more than surprising given stocks are sitting at their highest level in history. Other indicators of investor psychology include Wall Street letter writers and professional money managers who show bullish sentiment bordering on excessive. The current CBOE Volatility Index (VIX) reading indicates investor complacency, which some consider a sell signal. But the record shows that VIX sell signals are not nearly as reliable as buy signals with the VIX often late in turning up following a market downturn. Overall, the technical indicators are mildly bullish for stocks.
Thanks for reading.
Twitter: @WillieDelwiche
Any opinions expressed herein are solely those of the author, and do not in any way represent the views or opinions of any other person or entity.


