In the last few Daily blogs, we have covered a lot!
From the silver to gold ratio, to long bonds to the Euro versus the dollar.
And that’s not all!
We have looked at the 23-month moving average and how that has been an incredibly reliable indicator to assess where the economy might be going-or if it is going nowhere.
We also covered the agricultural ETF DBA, sugar futures and their significance-and most recently, looking at Utilities.
For today, we posted a short 11 minute video that I do for CMCMarkets in the U.K.
Here is the video (recorded April 4):
And please take some time to listen to a podcast with Madam Trader’s host Ashley Kyle Miller recorded March 20th https://open.spotify.com/episode/5wsel9HO3etLVRsneWndPb
Stock Market ETFs Trading Analysis & Summary:
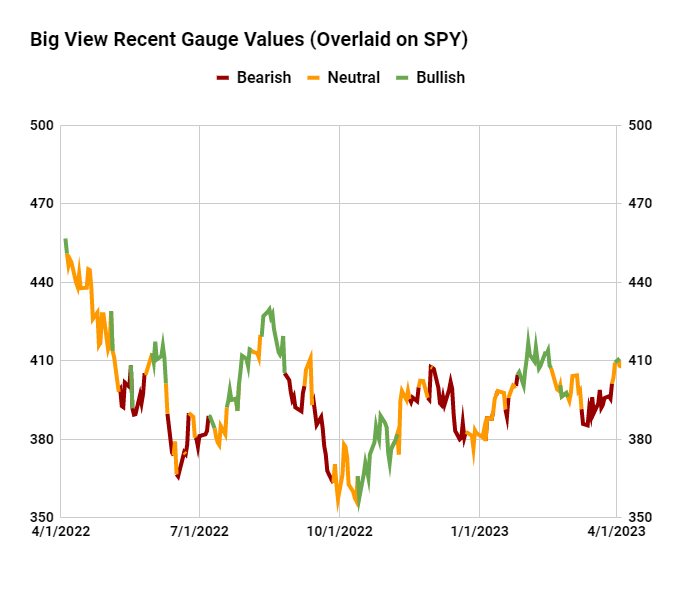
S&P 500 (SPY) 405 support and 410 pivotal
Russell 2000 (IWM) 170 support- 180 resistance still
Dow (DIA) Confirmed bullish phase and inside day-through 336.25 could go higher
Nasdaq (QQQ) 325 resistance 314 10-DMA support
Regional banks (KRE) 41.28 March 24 low
Semiconductors (SMH) 247 is the most significant support
Transportation (IYT) 219 the 200-week moving average to hold if good
Biotechnology (IBB) Exhibiting leadership, especially if clears 130
Retail (XRT) Don’t want to see this break under 59.75-and best if clears 64.50
Twitter: @marketminute
The author may have a position in mentioned securities at the time of publication. Any opinions expressed herein are solely those of the author and do not represent the views or opinions of any other person or entity.


