2017 has arrived and nothing changes for us here. We continue to look for what is going on in companies, and the markets more broadly.
2017 Trends, Opportunities, and Market Themes
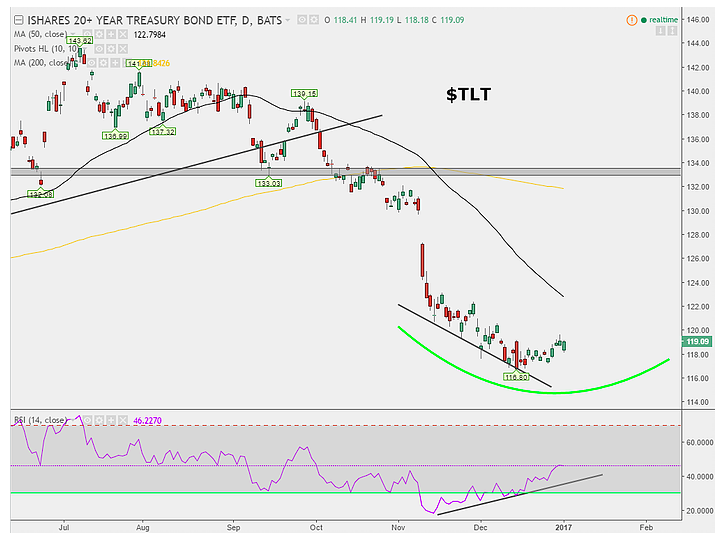
To start, I think bonds is a good place to continue looking at as we head into the new year. This is pretty contrarian at the moment, and that is a good thing in my view. We have been talking about the 20+ year treasury bond ETF (NASDAQ:TLT) for some time now, and it is still 1-2% away from our initial interest level. The longer we stay at these levels for TLT, the more likely sentiment will turn from outright negative to a little more optimistic, so patience is key.
We also are noticing some mixed signals from the stock market. While our more macro informed readings suggest upside, our volatility indicators suggest we could see some downside.
Next up, the AppleWatch (NASDAQ:AAPL). I just got one and I love it. Our indicators suggest that demand for the AppleWatch is rising.
Lastly, I want to share 5 themes worth watching over the long term.
Bonds Reward Patience
The long bond took a beating to end 2016. As I have shown in past posts, 2016 witnessed the worst week for TLT on record, along with the worst 90 day stretch on record. Since late December, we have pretty much flat-lined, experiencing back to back weekly gains for the ETF. The technicals are setting up nicely for a possible long bias. Price fell sharply, before recently turning flat, and RSI continues to make new highs. This will not be an overnight thing, but holding above that $117 low makes some sense.
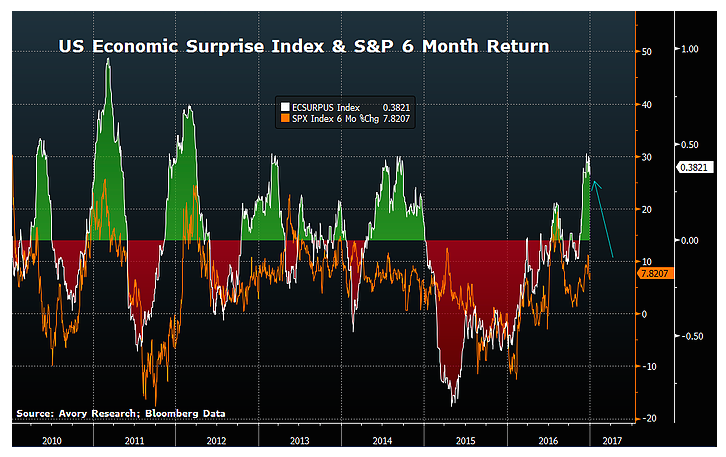
Economic Surprises Could Fuel a Rally
Using the economic surprise index as just one of our economic to stock market forecasts, suggests we could see ~13% gains over the next 6 months for the S&P 500.
However, the relative strength index for the Volatility Index (INDEXCBOE:VIX) is signaling potential weakness.
Using one of our many market based readings suggests that the S&P 500 could be gearing up for some weakness. Our reading suggests a 1 month move between -4.5% to -8%, however keep in mind there is some standard error to the reading. See chart below S&P 500 and VIX.

continue reading on the next page…

: Showing Some Signs of Emerging Strength")
