Before February 2018, the S&P 500 was positive for a record 15 months in a row. Despite the seemingly perfect track record, a series of daily record highs, and unprecedented levels of positive investor sentiment, the market’s tone changed abruptly in the last few days of January.
Since the record highs achieved on January 26th, 2018, the S&P 500 initially fell by 11% and subsequently recovered about half that loss.
The natural reaction for most investors following jolts to markets and changes in its behavior is to link the unexpected price declines with specific catalysts. In Thinking, Fast and Slow, Daniel Kahneman, a renowned Nobel laureate and behavioral psychologist, states, “[All] headlines do is satisfy our need for coherence.”
By assuming one knows the cause for a market event and how that cause may evolve, a great level of comfort can be attained. The catalysts blamed for the recent market swoon are higher interest rates, a hawkish Federal Reserve, trade and tariff threats, and volatility strategies gone awry.
While these are certainly affecting the market, we are not easily comforted by headlines.
We believe that constructing portfolios based on longer-term market and economic trends and not short-term market noise is the proper approach to managing money. In this article, we provide context to the recent price action and highlight the true fundamental and technical drivers of the market. Before a discussion of the current market environment, it is helpful to revisit a six month period beginning in August of 2015 that is analogous to today.
2015
After grinding higher during the first seven months of 2015, the equity markets hit a speed bump in mid-August. With little warning, the S&P 500 declined more than 11% over a six-day period. After two months of sharply increased volatility, the market recouped its losses. The rebound was short-lived, and the market subsequently fell 13%, ending below the lows seen in August. From that point, the bull market regained its positive momentum, and the S&P rallied over 50% to the late January 2018 record highs. We cite this tumultuous period because it helps differentiate a bull market correction from a bear market. The “catalysts” of the 2015 correction were strong indications of interest rate hikes from the Federal Reserve, an appreciating U.S. dollar, and warnings that said dollar strength was having negative economic effects on many foreign countries, most importantly China.
These concerns were valid, but they proved temporary. The dollar would continue to appreciate for another year and then head sharply lower as we are currently witnessing. China and other nations were able to depreciate their currencies and provide fiscal and monetary stimulus to overcome the effects of a stronger dollar. The Fed has raised rates, but at a slow enough pace to ward off financial concerns.
Those investors that rode out the unpleasant volatility of 2015 were rewarded for their steadfastness. Other investors, worried about mounting losses, diverged from their longer-term investment strategies and realized losses that in turn reduced their ability to compound wealth.
Today
By first presenting the 2015 experience, we show that even the most bullish markets, as we are currently in, are frequently met with periods that are not only counter-trend but highly uncomfortable. Periods such as 2015 are not only natural but healthy.
The graph below shows market volatility as measured by the difference between daily highs and lows. In 2017 the average difference was 0.51% (black line) as compared to the 1.32% (red line) difference that has thus far occurred in 2018.
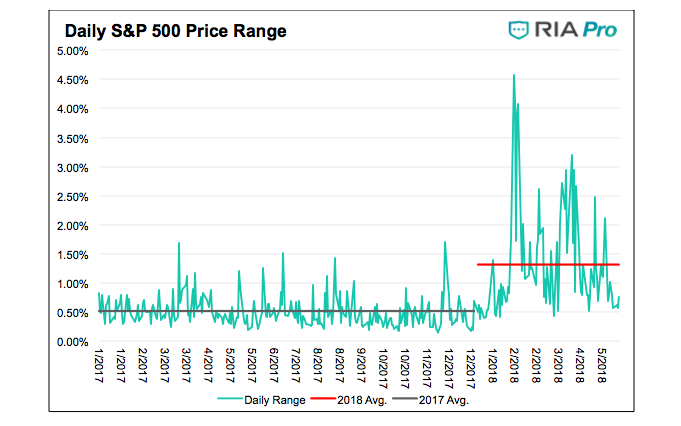
To put these moves into context, the average daily volatility for the five years preceding 2017 was 0.97%. In other words, daily price movement is certainly heightened in recent months, but it is not as alarming when compared to historical market volatility.
Further, it is important to keep in mind that most media outlets present daily market changes in dollar terms and not percentages. When shown this way, the recent sell-off seems larger than those of prior bear markets. For instance, the daily changes in the Dow Jones Industrial Average for the first week of April 2018 were as follows: -459, +389, +231, +241, and -573. The 573 point loss on April 6th was 65 points worse than the 508 point decline on Black Monday 1987. Black Monday remains the largest one-day loss in the DJIA in percentage terms at 22.6%. The recent 573 point loss was only about 2.5% of the total value of the DJIA. A similar decline like Black Monday would result in a loss of over 5,500 points.
It is quite possible that recent volatility is sending a signal that the upward trend since 2009 is reversing. As such, we believe it is important to closely follow the fundamental and technical drivers of equity markets and tactically manage risk accordingly. Below we provide a review of the current factors we think are most relevant. The highlighted factors are the ones we think will dictate market movements over the next few months.
Factors supporting further equity appreciation:
- The unemployment rate is at 3.9%, the lowest level since October 2000.
- Economic growth has shown signs of improvement in the U.S. and many developed nations.
- The S&P CoreLogic Case-Shiller 20-City Home Price Index is at 209.28, about 3 points above the all-time high seen at the peak of the housing bubble in July 2006.
- Small Business Optimism is at the highest level since September 1983, and the Michigan Current Consumer Sentiment gauge is at 17-year highs.
- Partially as a result of tax reform, corporate earnings growth is strong and running well above the historical average.
- The recent tax reform reduces taxes for corporations from a statutory rate of 39% to 21%.
- The current U.S. Consumer Price Index is slightly above the Fed’s inflation target but relatively tame at 2.4% and 2.1% excluding-food and energy.
- Increased deficit spending related to tax reform, the latest spending bill and the possibility of infrastructure spending, are all stimulative and further support already improving economic growth.
- Changes in global trade terms, something the administration is aggressively pursuing, may be net beneficial to the economy.
- Corporate equity buy-backs are expected to grow at a record pace in 2018.
Factors providing headwinds to equity appreciation:
- The current U.S. economic expansion has lasted 107 months and counting. Based on data since 1945, covering 11 business cycles, the average is 58 months, and the longest was 120 months (1991-2001).
- The Federal Reserve is planning to adhere to a gradual series of interest rate hikes and balance sheet reduction over the coming year. Other central banks are planning similar actions.
- The Federal Reserve has lost 44 years of policy-making experience with the departures of Yellen, Fischer, Dudley, and Lockhart.
- Geopolitical risks are extensive. Problems include instability in the Middle East, Southern Asia and the United Kingdom as well as friction between the U.S. and North Korea, Iran, and China.
- Equity valuations are at levels that have historically been met with hefty drawdowns.
- Longer-term interest rates have begun rising to levels not witnessed since 2011.
- The yield curve continues to flatten, which has historically served as a recession warning.
- Inflationary pressures could cause the Fed to withdraw liquidity at a faster pace than the market is expecting.
- Short volatility trading strategies may impose more market pressure.
- Trade debate could turn into a trade war, hurting both the domestic and global economy.
Our Approach
Per Goldman Sachs, “The average bull market ‘correction’ is 13 percent over four months and takes just four months to recover.” If recent developments in the equity markets are in fact a correction, a market decline of 13% would put the S&P 500 at 2500.
However, caution and prudence suggest that we consider that recent volatility may be signaling the beginning of a larger than normal correction, possibly even a bear market. We are fully aware that equity valuations are at historically high levels, and we are growing increasingly concerned that the reduction in the Fed’s balance sheet will negatively affect money flows to the equity markets. Further, with deficits rising rapidly and the Fed reducing their Treasury bond holdings, we must consider the effect of higher interest rates on economic growth.
As discussed in, Stoking the Embers of Inflation, there exists the possibility the Fed is unknowingly creating inflation while they and most investors believe they are dampening it. Lastly, it is possible that volatility in all asset classes rises and remains elevated for a sustained period. This is not necessarily a bad thing, as it may produce new opportunities. More importantly, it serves as a reminder to ensure that the expected return on investments per unit of expected risk is commensurate with your goals.
Evaluation of the positive and negative factors that drive the markets is time consuming but a necessary effort. The negative factors listed above are not trivial. At the same time, the positive economic impulses can often outweigh the negative ones, thus providing more horsepower to drive the market higher.
Twitter: @michaellebowitz
Any opinions expressed herein are solely those of the author, and do not in any way represent the views or opinions of any other person or entity.


