Teaching an old dog new tricks means that the tricks might be new, but the notion of doing tricks is familiar.
Case in point-currencies and trading currency futures.
We have traded ETFs UUP and FXE (dollar and Euro) in the past.
And, I have been vocal through the years on predicting dollar tops and bottoms relative to other currencies.
What I have not really done much of before is look at currency pair futures. Until lately.
Because of requests from traders that live overseas, we have been doing research, education and trade ideas focused on currencies and the futures rather than ETFs.
With that, I wish to share 2 charts (on the same currency pair) that I find interesting.
The platform we are using for the charts is TradingView.
A couple of pointers ahead of the analysis.
First, the ratio is defined by the lead currency. For the Dollar to Yen charts, this is how the dollar looks in comparison. So if the chart breaks out you are buying the first currency against the second one.
Secondly, we have our Real Motion Indicator on the TradingView platform. The rules are the same as when RM is posted on any other charting platform.
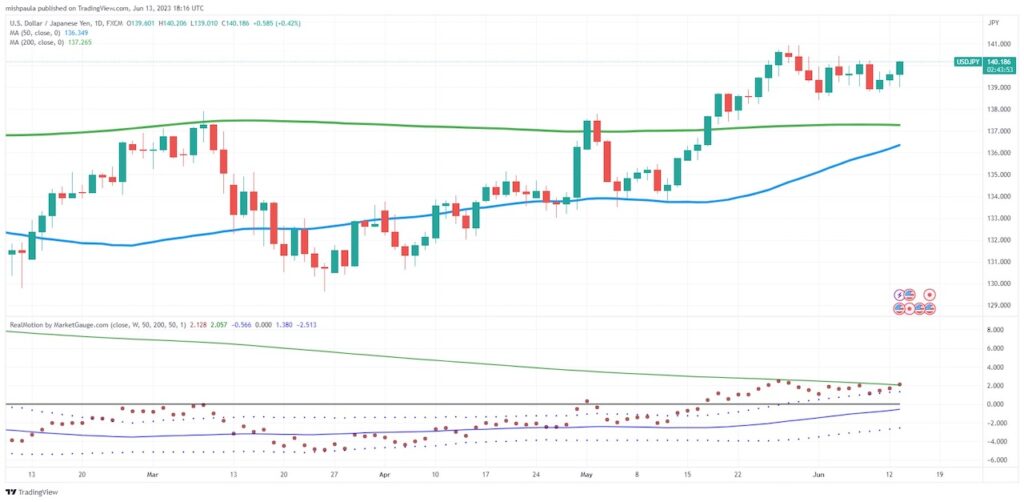
The first chart of the Dollar versus the Japanese Yen features a look since February-March 2023.
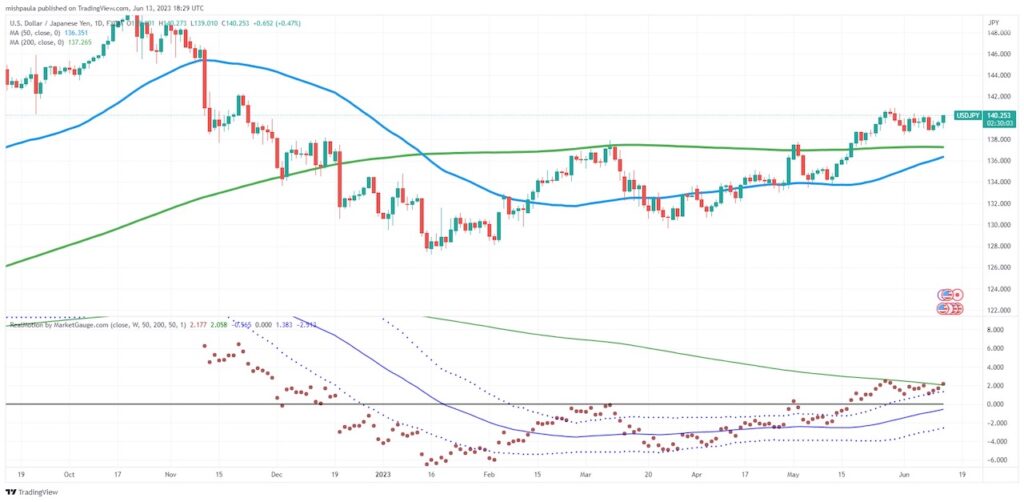
The second chart is the Dollar versus the Japanese Yen looking back to the breakdown in November 2022.
From February until mid-May, the dollar rose in price against the yen to the 200-day moving average twice and failed to clear that moving average.
On May 17th, the dollar broke out and held that 200-DMA and is now consolidating between 138 to 140.50.
Real Motion is more interesting in that the red dots (or momentum indicator) sits right on (slightly above) its 200-DMA.
The price had cleared it on May 17th. Now that momentum is finally catching up, it seems that a move above 140.75 is compelling.
The longer-term view chart tells us if the USD/YEN does indeed clear this resistance, it could run to 142, or higher.
The day it broke down hard or November 10, 2022 the selling began once price fell below 145.
That makes that level the strongest resistance.
Here are the fundamental implications:
The USD/JPY currency pair has traditionally had a close correlation with U.S. Treasuries.
When interest rates head higher, Treasury bond prices go down, which lifts the U.S. dollar, strengthening USD/JPY prices.
If the USD does indeed break out, we do have to ask, what might the implication be not only for yields, but also for the S&P 500?
Perhaps we are running too rich?
Stock Market ETFs Trading Analysis & Summary:
S&P 500 (SPY) Another move higher-starting to think we are close to a top 440 target
Russell 2000 (IWM) 23-month MA 193 still a bit away
Dow (DIA) 34,000 in the Dow-thinking next 6-months not as pretty
Nasdaq (QQQ) 370 max target
Regional banks (KRE) 42 support, 44 pivotal
Semiconductors (SMH) 150 now maj0or support. Lots of models took profits into this run
Transportation (IYT) 237 area the 23-month moving average
Biotechnology (IBB) 121-135 range
Retail (XRT) Cleared the 200-DMA at 62.95-if this is good, it will stay above that level
Twitter: @marketminute
The author may have a position in mentioned securities at the time of publication. Any opinions expressed herein are solely those of the author and do not represent the views or opinions of any other person or entity.


