These are some pretty amazing times we are living in is all I can say. Here are a bunch of charts I’ve created this week that paint a truly amazing picture of market sentiment.
Now first off, just remember that the Nasdaq Composite is at all-time highs, along with Small Caps. Meanwhile, the S&P 500 and Mid Caps are a chip shot from new highs.
Here are a handful of market sentiment polls I like to follow. You could argue one alone could be random, but if they all paint the same picture – that is more along the lines of a consensus. First up, the American Association of Individual Investors (AAII) weekly sentiment survey has the lowest number of bulls on an 8-week average since the March 2009 lows. In other words, the single greatest buying opportunity of a generation was the last time we saw this little bulls.
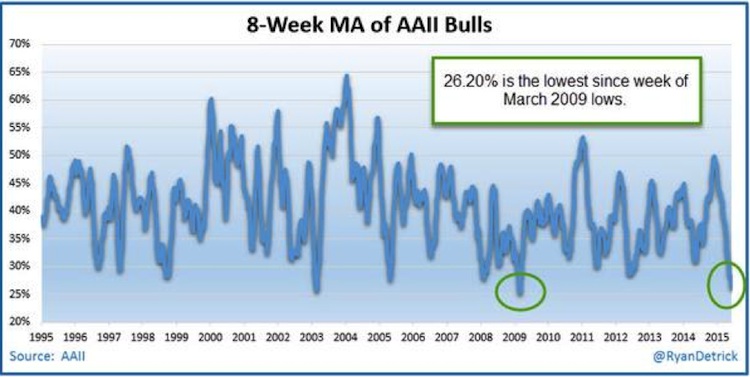
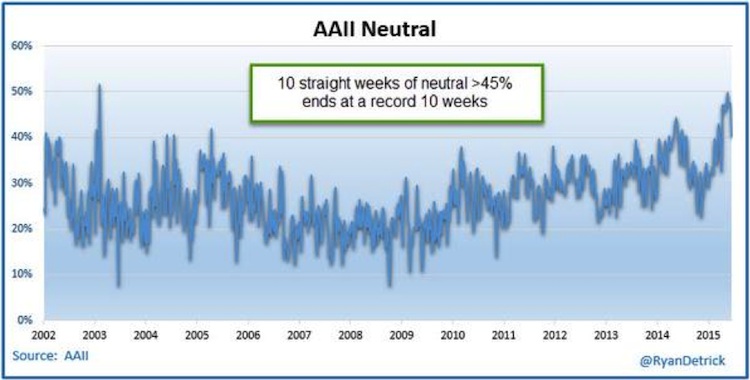
Now note, one reason the bulls are so low is due to the fact everyone is neutral anymore. Still, my take is neutral is the new bearish, as it is hard to say you are bearish after being so wrong for so long. I talked more about this one on Yahoo Finance earlier this week.
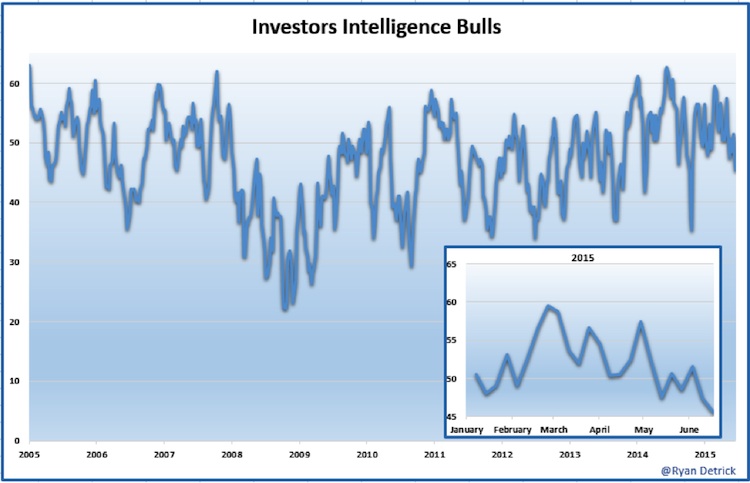
So the individual investor is far from bullish, what about newsletters? The Investors Intelligence poll looks at what newsletters are seeing out there. Wouldn’t you know it, the bulls hit a new calendar year low this week. That tells you where market sentiment is.
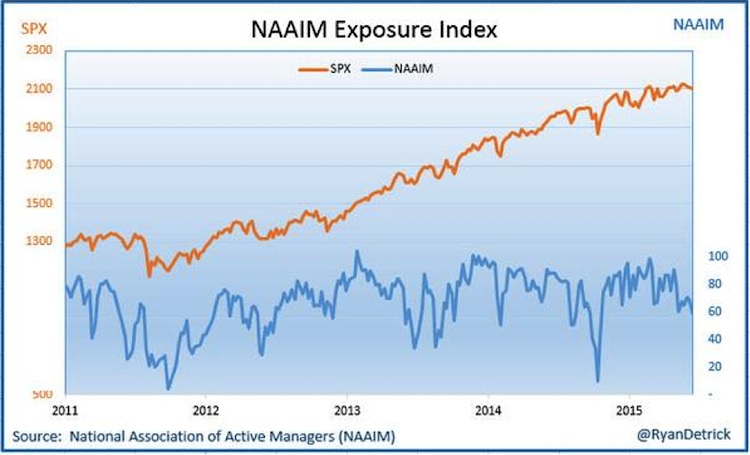
Next up, what are the active managers doing? I like this poll as it looks at what real managers are doing. The National Association of Active Managers (NAAIM) Exposure Index also came in at a calendar year low this week.
Now what I really like is when I tweet out these stats I’m bombarded with reasons they are wrong. The reasons vary from the AAII survey isn’t conducted correctly, to newsletters don’t know what they are doing, to you shouldn’t use the NAAIM as a contrary indicator because they are really smart money. Pick a side, I’m on the side that all this worry about stocks is a bullish thing. Then to see all this worry with new highs being made is something I’ve never seen in my 15 years at doing this.
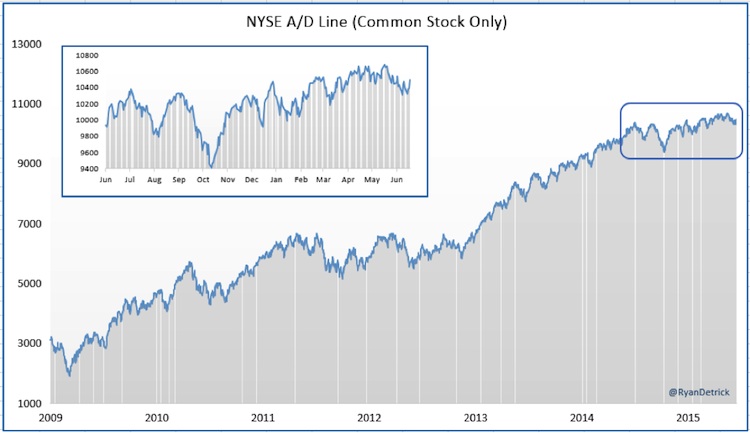
Now let’s take a look at the market internals for a second. I’ve long said I’d rather look at advance/decline charts all day versus the major averages. The true story is told by how the soldiers are doing. If the soldiers are pushing ahead in the battle, the odds of winning the war is much better.
The common stock only NYSE A/D line is holding firm. It hasn’t broken out yet, but by no means is it breaking down either. Nothing wrong here.
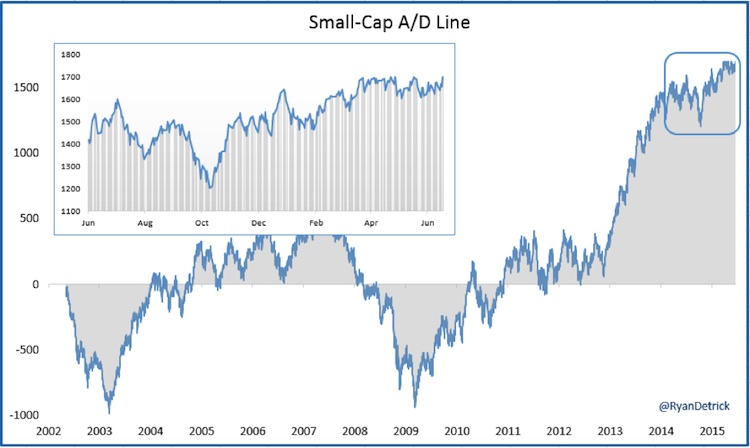
Leadership in small cap stocks is something we are starting to see again and that is always a good sign. The small cap A/D line is on the verge of breaking out, confirming a new leg in the bull market.
Think about it. What are the three things that have been in place for six years now? Price action is strong, sentiment is overall rather skeptical, and an accommodative Fed. I’m saying those are all still firmly in place and the bull market is alive and well.
Good luck out there and thanks for reading.
Twitter: @RyanDetrick
Any opinions expressed herein are solely those of the author, and do not in any way represent the views or opinions of any other person or entity.

 and Russell 2000 (IWM)")


 and Russell 2000 (IWM)")
