For the past several months the market has been fighting off weak global demand and slowly shifting to a new business cycle that should see the US consumer take the lead. Cyclicals and Financials appeared to be leading an early market rotation but that turned out to be a false start as the late summer mayhem took ahold of the stock market (see my June article for reference).
After a big rally, the market is once again starting to show early signs that market rotation may be picking up where it left off. But we may still be in the early “fits and starts” phase of the cycle, as Crude Oil continues to act sluggish (more on that later).
In the first chart below we get a glimpse of early market rotation (the chart shows sector performance from August 20-October 26). One key takeaway is that while the S&P 500 Index was entering bearish territory in mid-August, Cyclicals and Technology were starting to demonstrate strength in an uncertain market (note that these two sectors also tend to be leaders during periods of early growth and market rotation).
It is also worth noting that Industrials have also perked up.
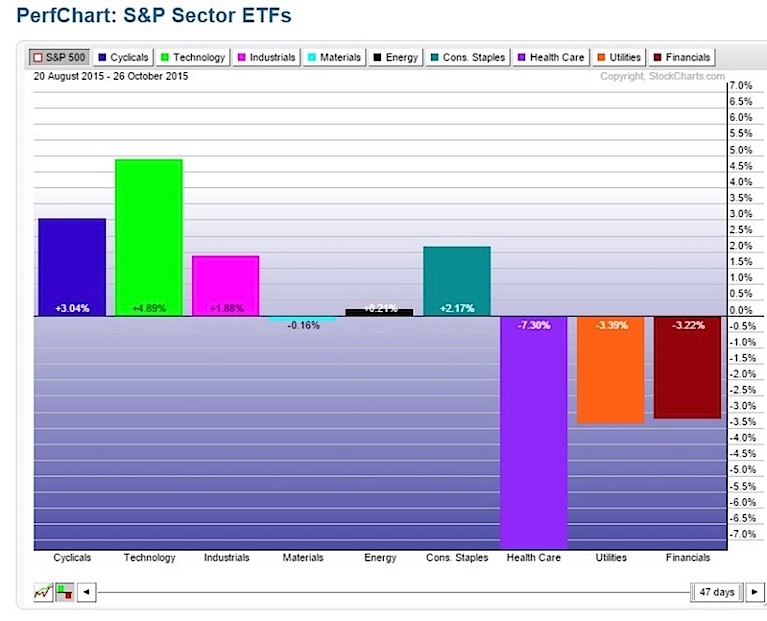
PerfChart: S&P Sector ETFs by StockCharts.com
Crude Oil is another important variable to the global marketplace. Oil has proven time and again that it leads the intermarket dance. In a global economy, it is a barometer that should not be ignored.
In June, China’s Shanghai Composite (SSEC) collapsed. Crude Oil had been trading heavy throughout early 2015, and soon followed in another leg lower. The contagion then spread to US equities, as the S&P 500 ended its sideways trend and headed into bearish territory.
So, yes, Crude Oil is important to monitor. In 2015, it has served as a quiet cautionary flag. Below is a chart highlighting it’s suppressed prices. Could it be heading lower yet again? Crude oil seems to be telling us to remember that sustained growth is dependent on global strength.. so we may have to be patient just a little bit longer.
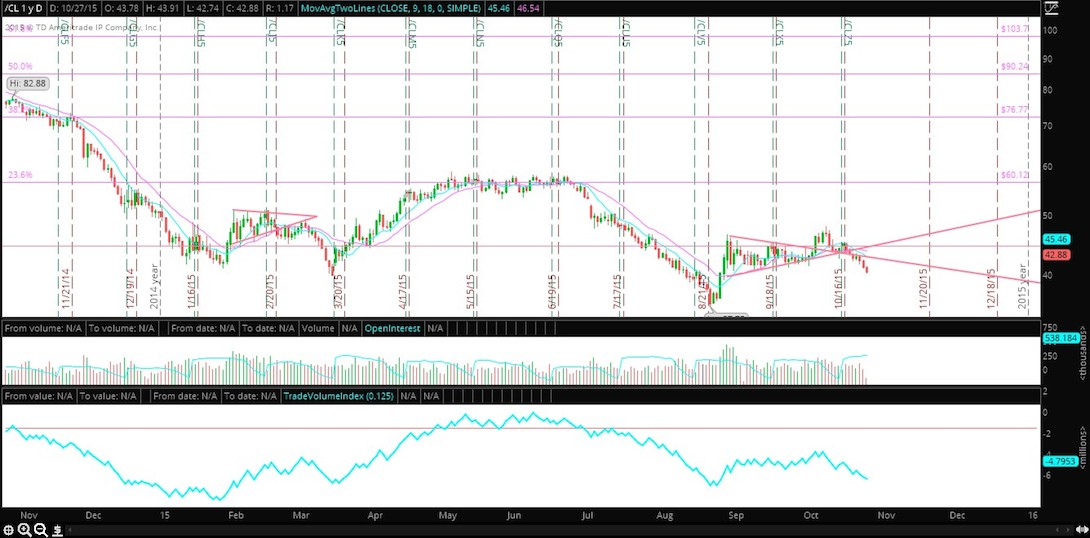
Light Crude Futures Weekly by Think or Swim.
Lastly, I want to discuss the price action in Ford (F). The autos are consistently early movers in new business cycles, so following a sector leader here makes sense. Enter Ford (F). The weekly chart below highlights Ford’s stock rally higher into earnings this week. Although Ford was dinged a bit on earnings, it’s important to note the rally back to the top of a two-year bearish channel. If Ford’s stock price can rally and breakout in a new trend higher, it would mean a lot to the American Automakers and the storyline that the US consumer is ready to buy again. Could a breakout in Ford’s stock be the beginning of the market rotation and new business cycle? We’ll have to wait and see.
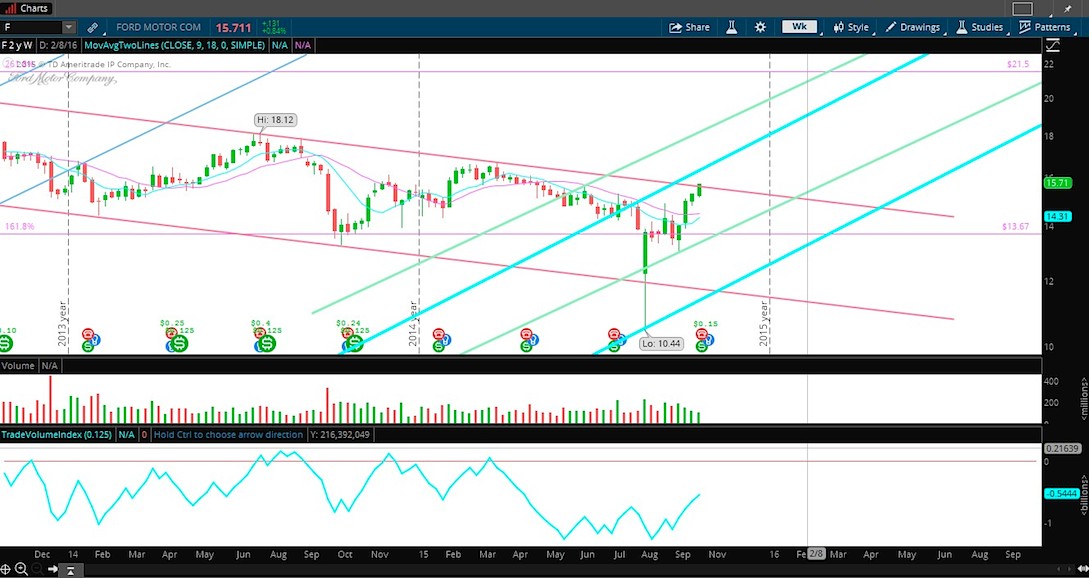
Ford Weekly by Think or Swim.
Thank you for reading.
Twitter: @rinehartmaria
No position in any of the mentioned securities at the time of publication. Any opinions expressed herein are solely those of the author, and do not in any way represent the views or opinions of any other person or entity.


