Over the last six months, the stock market has traded in a long boring side-ways wave. But signals are there that things should begin to get interesting again in the months ahead, especially as we look at cyclicals.
The charts below include 5 things that I will be watching over the coming weeks as the summer price action plays itself out.
They include:
- Sector performance (with a focus on cyclicals)
- The Financial Sector
- Crude Oil
- Bonds
- Goldman Sachs (GS) stock
Let’s review this list from top to bottom, starting with a chart looking at sector performance since last September.
S&P Sector ETF Performance Chart, 200 Days
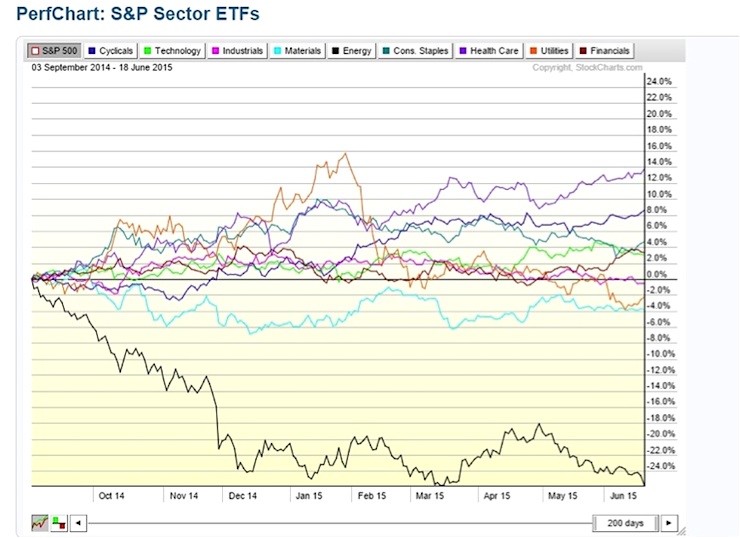
Notice Cyclicals and Health Care are the top performing sectors in this sideways market. Energy and Utilities have underperformed during the same period. To recap: cyclicals tends to outperform in the late bear market cycle and during a new bull market. In 2014, defensive sectors (Energy then Utilities) outperformed for much of the year.
So why was 2014 so defensive? Well, the writing was on the wall in late 2013 with lagging consumer wages and early rotation to Materials. As well, retail’s inability to get off the ground despite the euphoria around the Great Rotation from bonds to equities. The latter brought things to a halt from a market sector perspective. Clearly the rotation from bonds to equities had gotten ahead of growth on the ground and with the consumer.
However, one look at the PerfChart above and you’ll notice that cyclicals are back on the radar. This tells us that the market is cautiously becoming less bearish on its outlook for the consumer, the main driver of our economy. And that leads us to our next “watch list” group – the Financials Sector.
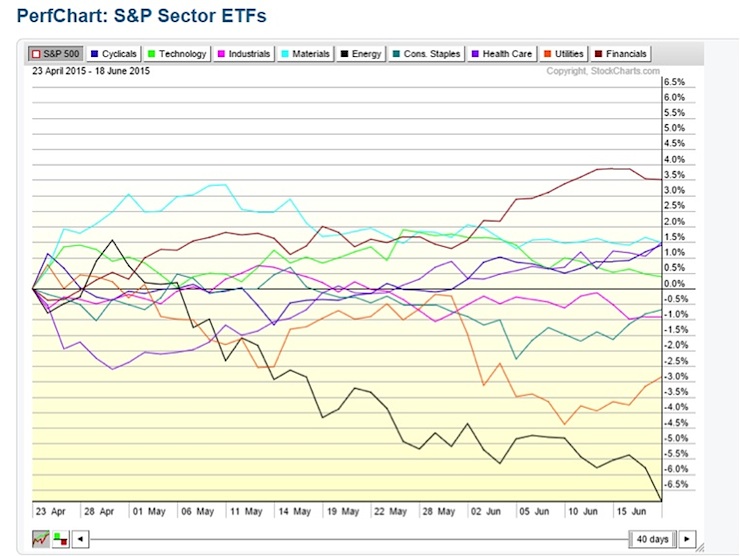
Financials
The Financials typically confirm the cyclicals outlook for the consumer. Since early May, Financials have begun to gain momentum. Bulls will want to see a continuation of leadership here.
S&P Sector ETF Performance Chart, 40 Days
Market Caveats On Radar
Light Sweet Crude Prices (Futures) – Weekly Chart
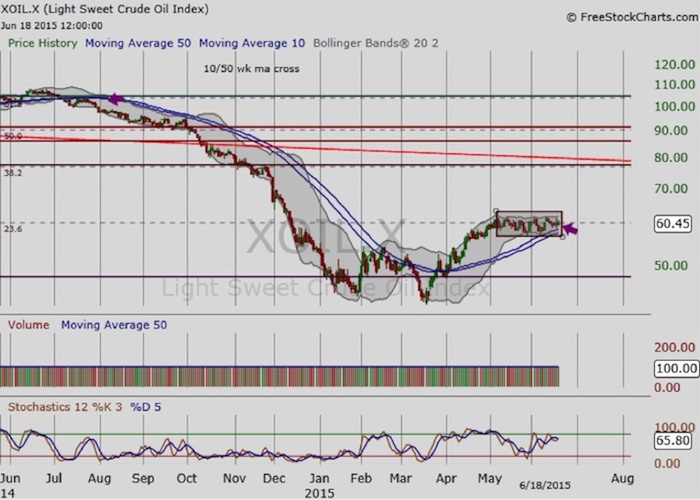
Crude Oil tends to lead stocks. Oil, until it fell off the cliff in late 2014, had traded in a tight band from the market bottom in 2009. Higher Oil prices meant that demand had returned and equities would soon follow, while oil under pressure was the first indicator to watch for slowing demand. From 2009 until 2014, this rotation was fairly predictable. Then Crude Oil fell of the cliff in late 2014.
The stock market has held up pretty well – much better than 2008-2009. It’s a different world today. We are not in a crisis mode, but the consumer is on a slow mend. So instead, what we’ve seen in equities over the last several months is this slow grind to nowhere.
A sustained break out of the flag pattern will tell us the consumer is ready for higher gas prices.
20+ Year Treasury Bond ETF (TLT) – Daily Chart
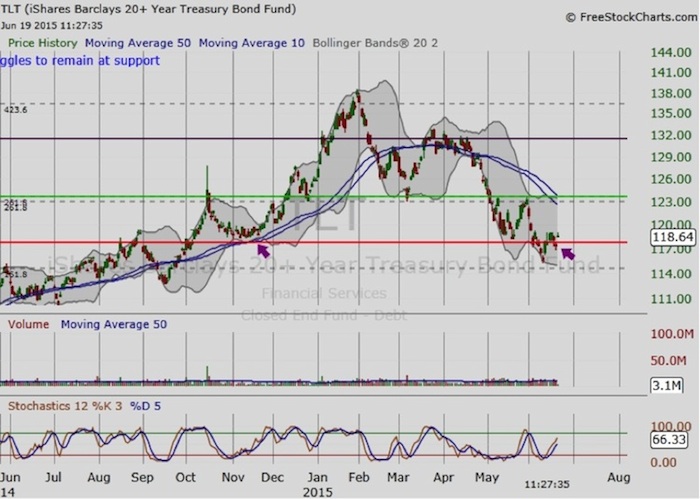
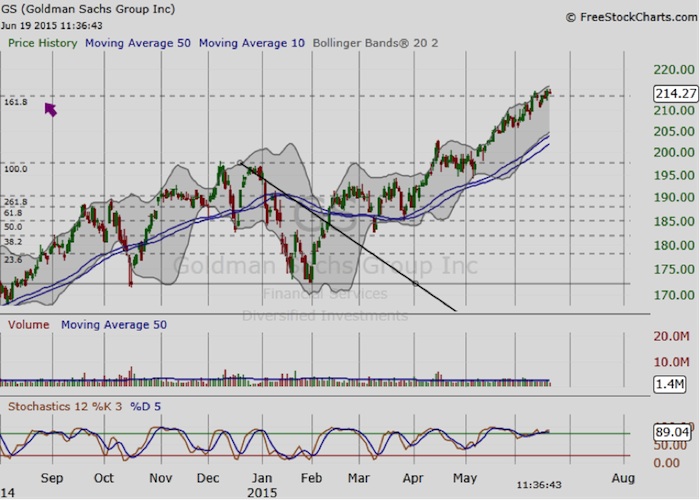
Look left, and note that the 20+ Year Treasury Bond ETF (TLT) is back at an important price support level. Stochastics has turned up. Typically, when long-term bond prices are rising, this indicates that interest rates or demand for financial products are declining. This would likely be bearish for financials, even if just seasonal. A quick look at consumer banks like Bank Of America (BAC) and Goldman Sachs (GS), and note that they are either coming up on past resistance or their next Fib Level. Here’s a chart of GS.
Goldman Sachs (GS) at 161.8 Fib Level
Take Away
We are nearing a pivotal point in time. It may not be as dramatic as what the market has become accustomed to in recent years, though. Even so, it will likely be more interesting than the slow grind to nowhere we’ve seen thus far. At a minimum, it indicates a time to begin looking again at cyclicals, e.g. autos and retail, and financials, or new innovations and technology for the months ahead when a new cycle begins anew.
Thank you for reading. Have a great summer.
Twitter: @rinehartmaria
No position in any of the mentioned securities at the time of publication. Any opinions expressed herein are solely those of the author, and do not in any way represent the views or opinions of any other person or entity.


: Showing Some Signs of Emerging Strength")
