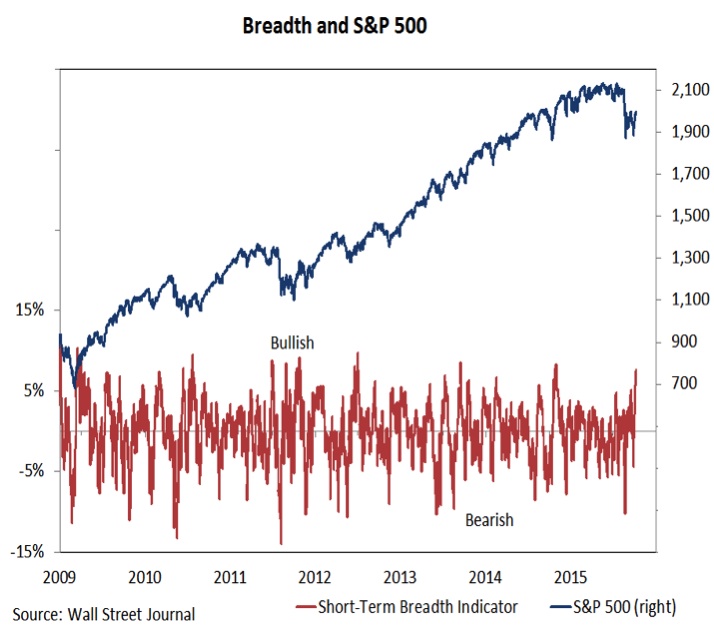
Market Breadth vs S&P 500
This short-term market breadth momentum indicator (similar to the McClellan Oscillator) suggests there is some upside momentum that has emerged.
It has moved to a new high after making a higher low. Based on the improving tone from both a price and market breadth momentum perspective, we could see higher highs in stocks following a period of consolidation to digest the recent 120 point move in the S&P 500.
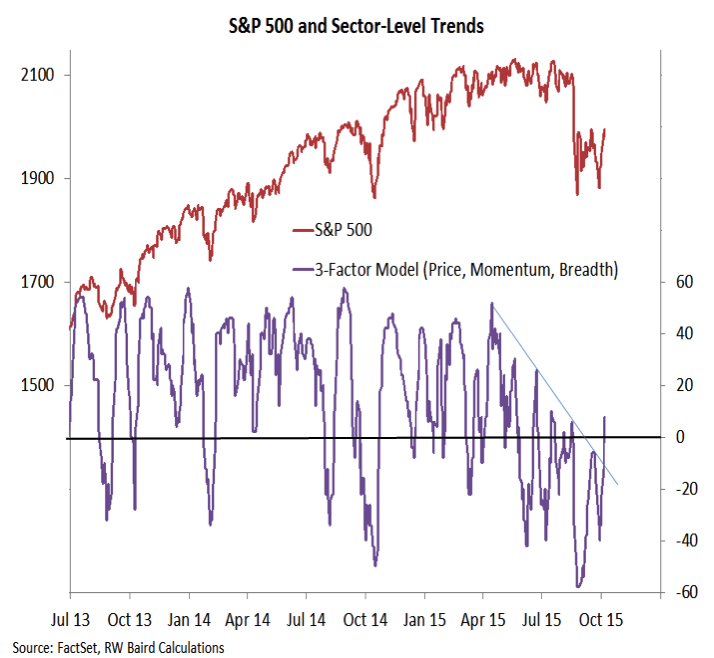
Sector Trends
Another way to view sector-level strength is with our 3-factor model, which looks at sector-level trends for price, breadth and momentum. This indicator has made a higher low followed by a higher high, and in the process broken above the down-trend that emerged as the S&P 500 moved into a tight trading range earlier this year.
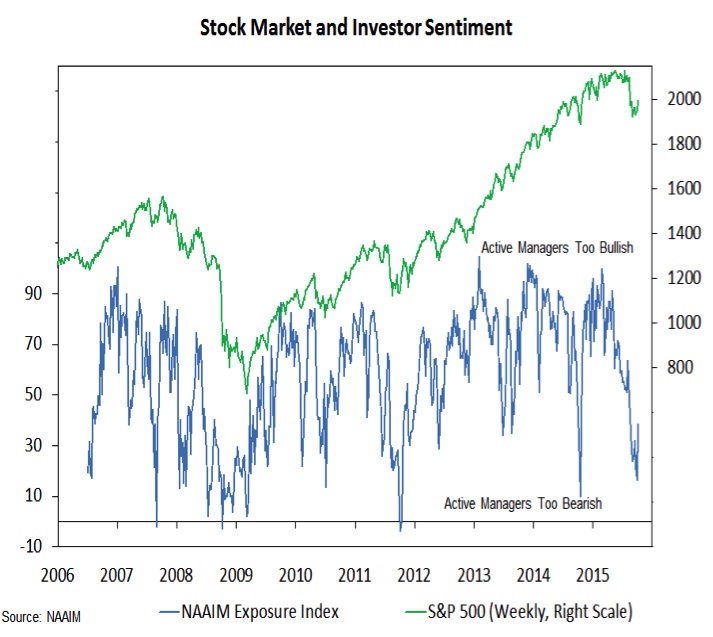
Investor Sentiment
Investor sentiment pretty clearly moved to excessive levels of pessimism at the recent stock market lows. A question now is if optimism comes back, and if so, how soon. The NAAIM exposure index bounced this week from 16% to 38%. Similar moves in investor sentiment were seen off of the 2011 and 2014 lows. The difference is that in 2011 the exposure index stalled after the initial bounce and it finished the year at 45%. In 2014, optimism soared and the exposure index finished the year at 95%.
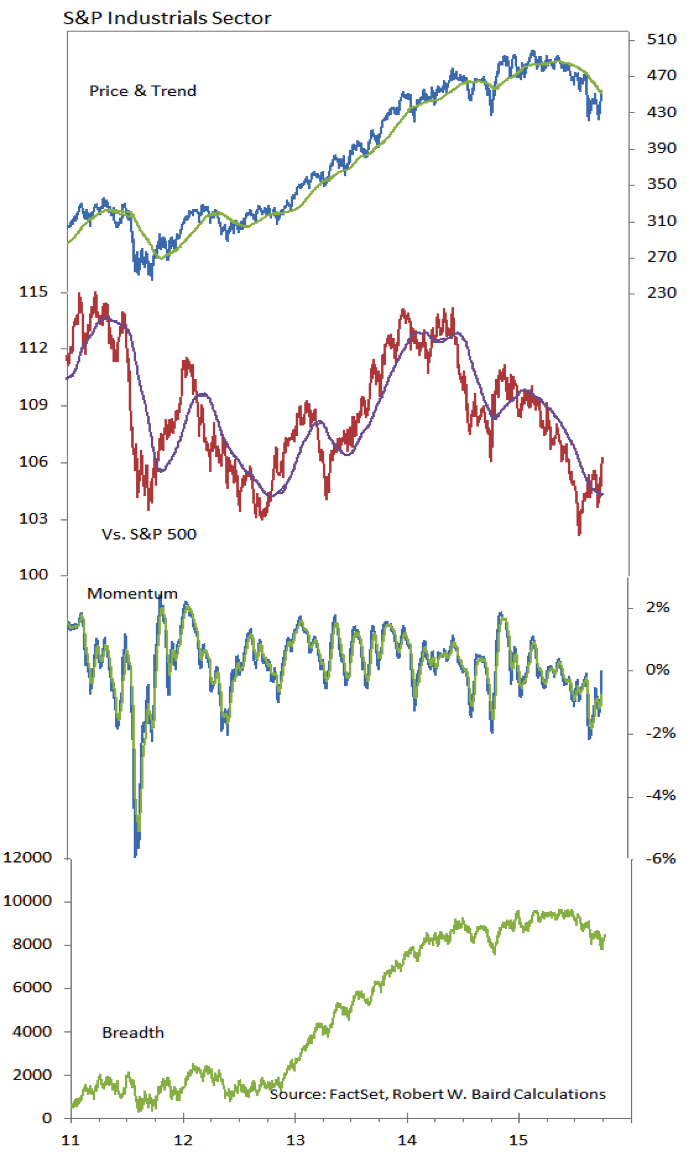
A Look At The Industrials
The oversold bounces in Energy and Materials are getting a lot of attention, but the more sustainable move may be coming from the Industrials sector. Price held suppot and is challenging resistance, while both the relative price and momentum lines have made higher lows and higher highs. Market breadth has been a bit slow to pick up, but if this turns higher, it could be the Industrials sector that is soon arguing for a spot among the relative strength leaders.
Thanks for reading and have a great weekend.
Twitter: @WillieDelwiche
Any opinions expressed herein are solely those of the author, and do not in any way represent the views or opinions of any other person or entity.
: Creating Bullish Divergence?")


 and Semiconductors (SMH): Concerning Price Pattern?")


