by J.C. Parets
Today I want to talk about bases. This is something that rarely gets discussed for whatever the reason, but I think they can provide some of the most explosive opportunities in the market. The old saying goes, “the bigger the base, the higher in space”.
But what exactly constitutes a base? What are some of the characteristics that we should look for as market participants? And why is it that the resolution from strong bases is so explosive?
First of all, what is a base?
It can be described in a number of ways but I like to phrase it simply as an extended period of time where prices remain within a well-defined range with a fixed floor and a fixed ceiling. Whenever prices reach the upper end of the range, the sellers come in, but when prices get down to the bottom of the range, the buyers step up. This goes on for a longer than average period of time until it resolves itself in one direction or another.
These ranges can be sideways, or slightly inclined, but the supply and demand dynamics that create the explosive resolution remain the same. Another important aspect to remember is that these can come on time frames of all kinds. So regardless of whether you’re a long-term investor or a short-term trader, there are bases for everyone on daily, weekly, monthly and even down to intraday charts. Also, these can be found across asset classes. This is strictly a supply and demand phenomenon so the strategy can be implemented in bonds, commodities and currencies, not just in the stock market.
A recent example of a breakout from a well-defined base was in the Dow Jones Transportation Average back in early 2013. In this case, the base was declining slightly, but the upper and lower boundaries were well-defined. I think this is a great example because while the Dow Industrials were trending higher in 2012, the transports remained flat. Imagine how frustrating it must have been to be in that market?
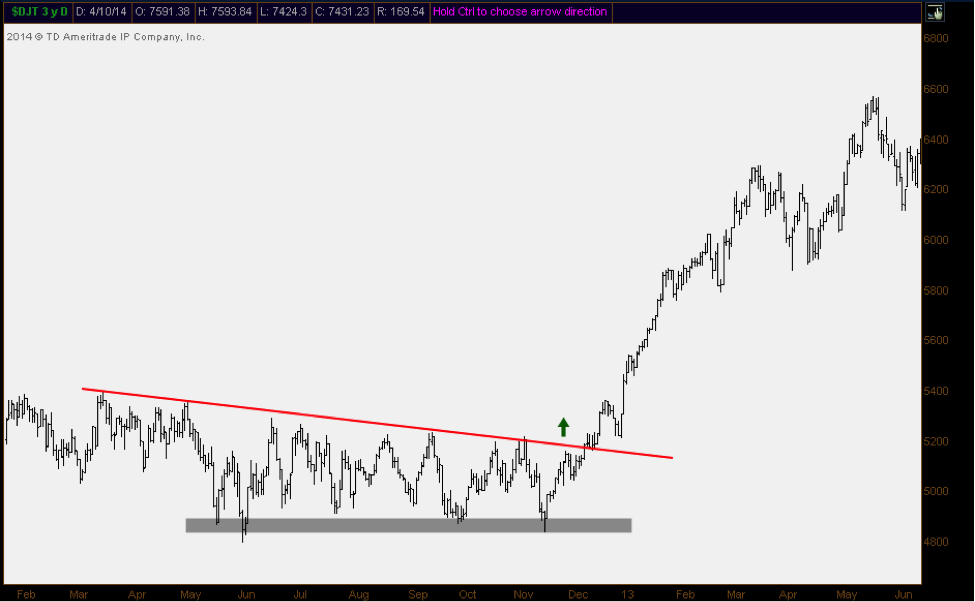
The resolution out of this base consolidation was explosive. The Dow Transports were the big winners in 2013 and got the year off started really strong. Look how nice that uptrend became. There were barely any pullbacks for months. In fact, Transports rallied 50% from December of 2012. For an index to do that in such a short period of time is very impressive and provides us with a great example of the power of strong bases.
You see what happens in a case like this is that both the bulls and the bears become frustrated for an extended period of time. No one is winning and they just start to give up. That’s when the explosive move occurs; leaving everyone in the dust that had decided to throw in the towel. My friend Brian Shannon at Alphatrends.net has an old saying that, “if they don’t scare you out, they’ll wear you out”. I think the psychology behind these bases has a lot to do with the fact that participants are just worn out of that market and recognize the opportunity cost they’ve had to endure while waiting for a resolution. By the time the market breaks out, it’s just been too painful to remain in the trade. And that’s when you get the explosive move.
There are some things we can look for to add breakout potential to these bases. One of them is improving momentum. Often times you’ll find that while the base is building and participants’ frustration levels are peaking, momentum has already turned up. I personally like to use a 14-period RSI for my momentum readings, but other alternatives to that behave in a similar manner. You can also look at sentiment readings. Nice long bases where sentiment data is showing extreme bearish readings can really resolve themselves violently. You’re getting a base breakout and short-squeeze all in one. We love that.
The final false move that creates the eventual breakout.
My favorite characteristic of a base is that brief shakeout before the eventual resolution. “From false moves come very fast moves in the opposite direction”, is the way I was taught. After a long frustrating base consolidation, sometimes you’ll have a brief shake out in one direction, only to quickly turn around, get back into the range, and then break out in the opposite direction.
I think US Treasury Bonds are a good example of a lot of these characteristics. First of all we came into the year with historic bearish sentiment. That’s red flag number one. As you can see in this chart, the base has been well-defined since last summer. It has been classified as a “dead market” according to the anchor in one of my recent media appearances. You can see the support and resistance levels coming into play over and over again.
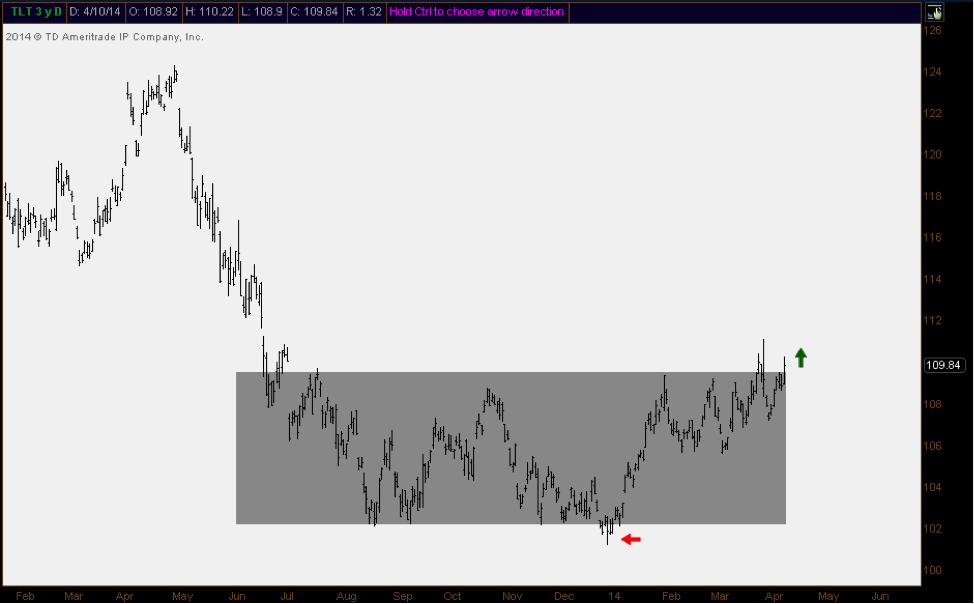
Now look at the shakeout at the end of December. Do you see that false breakdown and quick recovery that is now leading to this potential breakout to the upside? It’s that last final shakeout that helps to create these explosive resolutions. What I like about this one is the fact that momentum (if you look at a 14-day RSI) had been turning higher throughout the 4th quarter, you got the shakeout in December, and we were coming off historic bearish sentiment in the market. The tifecta. These are the ingredients for the perfect base breakout. The uptrend that should ensue could be very powerful.
From a risk management perspective, these bases provide very clear levels of support and resistance. The idea is to get long the market on a breakout above that long-time resistance, and remain long as long as prices remain above it. You don’t want to get caught in a trade that goes against you, especially after a long base. So the risk/reward becomes very easy to quantify, but you have to stay disciplined.
Price target-wise, the way I was taught is to take the size of the base, which is the distance between the upper and lower range, and then add that to the breakout level. Although this is historically the way to achieve measured move targets, these long bases tend to exceed those levels and travel to distances few ever expected. So while we may get an initial target based on a measured move, we must keep in mind that this is just the initial target and we should not be surprised to much higher prices down the road.
Finally I’d just like to add that these supply and demand dynamics work in both directions. I’ve provided a couple of examples of bases that have or potential will break out to the upside. But the same thing works in tops. The old saying is, “the bigger the top, the bigger the drop”. We saw a lot of these patterns develop through 2007-2008. The downtrends that were created were some of the most powerful in market history. This is obviously an extreme example, but a good one nonetheless. Go back and take a look at some of those charts. You’ll find plenty of examples.
If you have any questions on base consolidations or otherwise, please feel free to email me at jc@eaglebaycapital.com. You can also follow me on Stocktwits and Twitter @allstarcharts.
Thanks to See it Market for including me once again.
JC
About J.C. Parets: J.C. is a Chartered Market Technician (CMT) and a member of the Market Technicians Association. He is also the founder of Eagle Bay Capital and the author of allstarcharts.com. J.C. has appeared on numerous media outlets such as Bloomberg and CNBC.
Any opinions expressed herein are solely those of the author, and do not in any way represent the views or opinions of any other person or entity.


