I’m honored to be invited by Andy to join the ranks of Market Masters, and know full well the high caliber of other contributors to this segment.
To get things rolling, I decided to focus on one of the greatest challenges all strategists and traders face: stock picking. Or in my case, exchange traded fun picking (ETF trading), as that’s my bread and butter.
Most of you reading this are probably familiar with the concept of a top-down approach that involves first identifying the primary trend in stocks, then focusing on the best-performing sectors, industries, and finally individual names. But you may not have a concrete plan for how to achieve this objective.
I provide here a methodical approach for selecting exchange traded fund candidates to trade. This approach is targeted at position traders with a time horizon of approximately two to 12 weeks, but flexibility to hold for longer when appropriate. I limit this discussion to long trades; in my experience, you generally can’t use the same toolkit to trade well on both sides of the market. With that in mind, I’ll outline my approach to ETF trading and then comment on it.
The Five-Step Program to ETF Trading
- Universe: All exchange traded products associated with equities (including international) that have an average daily trading volume of at least 100,000 shares over the past three months, on a rolling basis.
- Primary Trend: Be bullish when the 12-month simple moving average of the S&P 500 is rising, bearish when it’s falling.
- Strong Trend Screen: All candidates that are trading above the 20-week simple moving average and whose 20-week average is above where it was four weeks ago.
- Superior Relative Strength: Of those in strong trends, all candidates that have outperformed SPY (S&P 500 Depository Receipts) over the past four weeks and the past 12 weeks.
- Superior Reward/Risk Scenario: Candidates in strong trends, showing superior relative strength, that show the most attractive trade set-ups, and the greatest upside potential between the current price and technical resistance based on past areas of congestion or turning points.
Method Behind the Madness
The point of the five steps is to minimize the subjectivity when deciding what ETFs to trade. It isn’t until the fourth or fifth that you incorporate your own chart analysis.
I’ll spare you by limiting my long-winded comments to just one of the five steps, the one that I think never seems to get enough attention. I can’t stress the importance of relative strength enough. This is the best indicator of what areas of the market are in favor. In my early years as a market technician I ignored relative strength because I thought price charts would show enough to make good decisions. This was to my detriment. Chart patterns don’t always work out; in fact, they seem to fail more and more as shifts in psychology that used to take weeks now can happen in a few days or less with the advent of high-speed trading. Anyone with a time horizon beyond a few weeks should consider relative strength charts to be of equal importance to price charts. I use moving averages in order to reduce whipsaws in relative strength lines and find this to be effective. It also makes screening easier, as I look for candidates whose fast RS average is above the slow average, with both rising.
Brace Yourself: It’s Time to Think
The first four steps to ETF trading are purely rules-based (the fourth may have some room for subjectivity but not much). All of the thought process went into establishing the rules, not formulating an opinion based on variables that can be interpreted in different ways. Now it’s time to act on trade set-ups that you deem to be attractive.
The long set-ups I look for are generally buying at the daily or weekly mean (20-period moving average), as this often precedes a resumption of a larger uptrend, and range breakouts. With both set-ups, you generally have a clear idea of the point at which you’re wrong. If the market does end up moving in the direction of the trade, I look to establish a trailing stop such as a downturn in the 20-day moving average. This incorporates a trend following approach, and there’s no need for a price target, and time horizon is determined by the stop. I find this to work better than using price targets because it provides a specific exit rule and removes emotion from your exit strategy.
Once you’ve decided what to trade, you need to consider portfolio risk in addition to risk on the single trade when determining position size, which I’ll talk about another time. Suffice it to say, you should enter every trade assuming it’s going to go bust, and then determine how money you’re willing to lose. Don’t think about how much you could make on the trade; your trailing stop will answer that for you.
Show Me the Money, Burba!
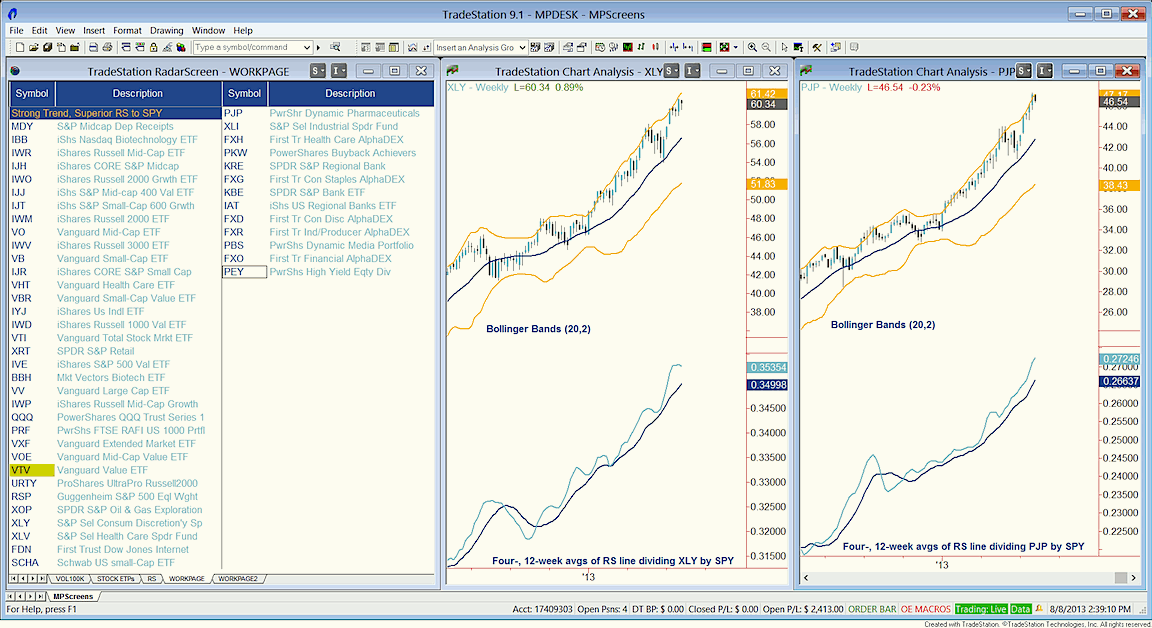
Okay, fair enough. The ETF trading table shown above comprises 47 equity-related exchange traded products that are trending above their 20-week simple moving averages, whose 20-week averages are above where they were four weeks ago, and which have outperformed SPY over the past four weeks and the past 12 weeks. Click image to zoom. I’ve highlighted two that are among the most attractive candidates: XLY (Consumer Discretionary SPDR) and PJP (PowerShares Dynamic Pharmaceuticals). Both are trading at or near the upper Bollinger Band, signaling extended conditions, but past history shows they’ve often continued higher in this situation just the same. Meanwhile, the relative strength averages in the lower half of the charts are trending sharply higher.
Sounds Great But How Do I Do This on My Own?
Any TradeStation users out there are welcome to contact me at chrisburba@mianalysis.com for EasyLanguage code you can use for the relative strength averages and strong trend screen in Radar Screen. Also visit me at miAnalysis.com.
I hope I’ve at least given you something to think about, and if you’ve read this far I’ve at least succeeded in not lulling you to sleep. Be well and trade well, everyone. My very best, Chris Burba.
Twitter: @ChrisBurbaCMT
Chart/Table Source: TradeStation
Any opinions expressed herein are solely those of the author, and do not in any way represent the views or opinions of any other person or entity.


: Showing Some Signs of Emerging Strength")
