Broad Market Outlook for Jan 24, 2018
The bullish price action extends the major stock market indexes to new highs once more. WATCH SUPPORT LEVELS for holds to enter; failed supports will bring countertrend fades into view.
Note that you can access today’s economic calendar with a full rundown of releases.
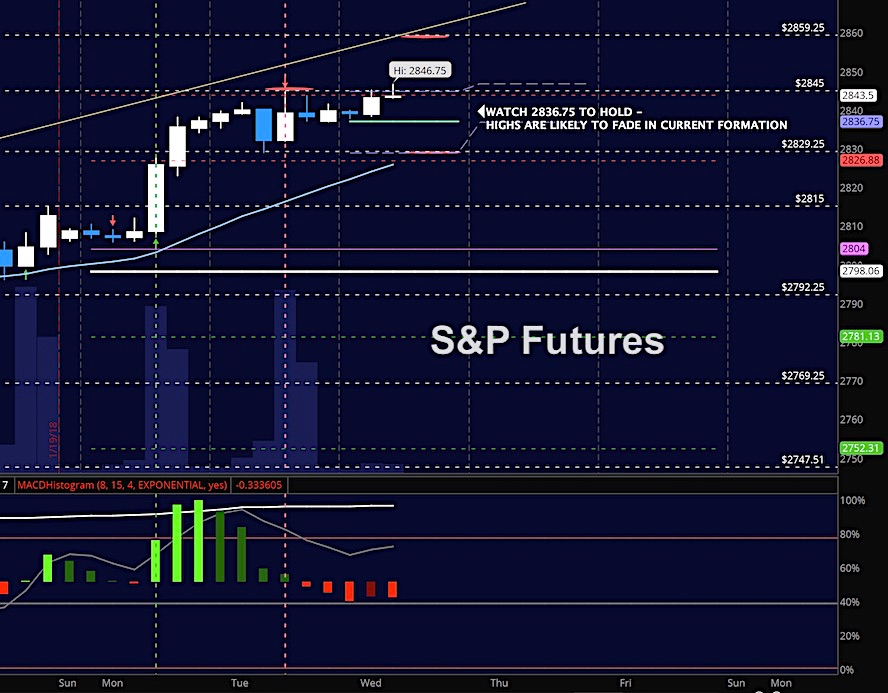
S&P 500 Futures
Trending motion is often difficult to follow after periods of “rise and fall” motion, but indeed, a watch of support and its failure to break keeps us on the right side of these trades. Taking long trades at pullbacks remain the best course of action while buying breakouts still expose us to more risk in the current chart extensions that push us further from our moving averages. The bullets below represent the likely shift of trading momentum at the positive or failed retests at the levels noted.
- Buying pressure intraday will likely strengthen with a positive retest of 2845
- Selling pressure intraday will likely strengthen with a failed retest of 2835.75
- Resistance sits near 2845 to 2852.25, with 2859.25 and 2872.5 above that.
- Support holds between 2836.25 and 2829.25, with 2822.25 and 2812.75 below that.
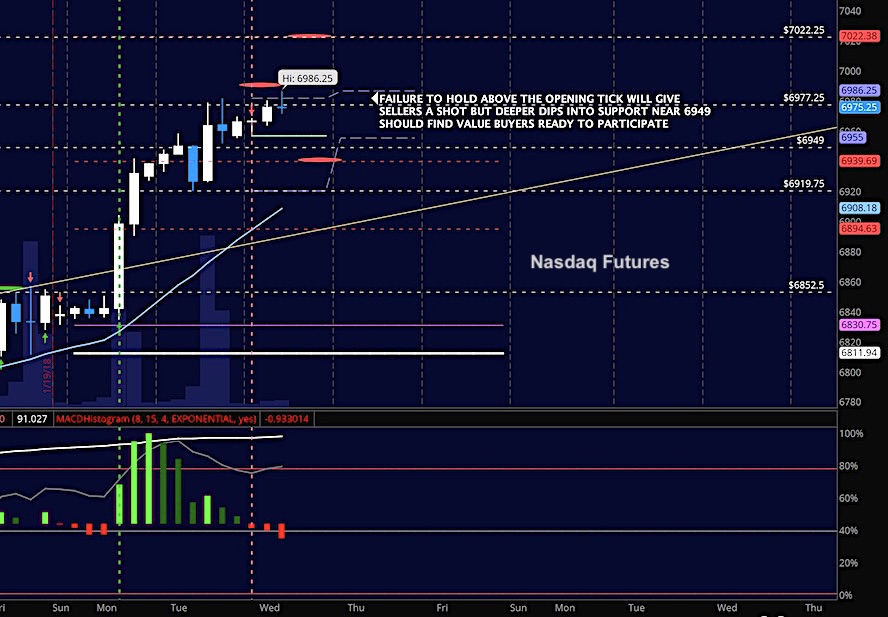
NASDAQ Futures
The NQ_F also tests new highs as earnings season continues to gather steam. Support watchs remain important in these formations so with a new higher low near 6949.75, that’s where we will focus our attention to consider picking up longs. If we decide to short at the new highs we see here, our stops need to be tight and support zones will be clear profit targets. Use caution with shorts in this very bullish environment. The bullets below represent the likely shift of intraday trading momentum at the positive or failed tests at the levels noted.
- Buying pressure intraday will likely strengthen with a positive retest of 6980.75
- Selling pressure intraday will likely strengthen with a failed retest of 6949
- Resistance sits near 6980.25 to 6994.25 with 7000.5 and 7022.5 above that.
- Support holds near 6970.75 and 6949.75, with 6919.25 and 6897.25 below that.
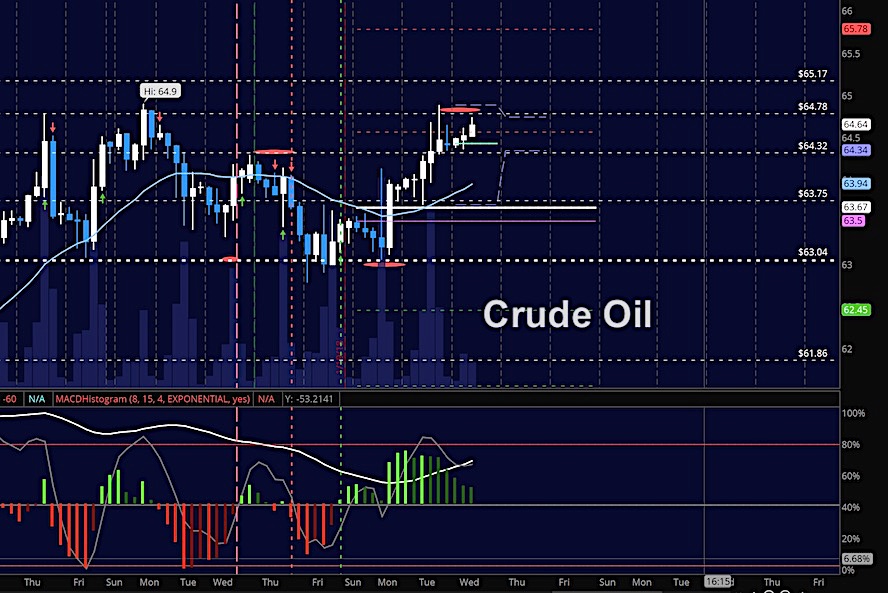
WTI Crude Oil
Oil began a breach of its landlocked regions yesterday and his holding higher today into the EIA report. Support to watch today will be near 64.06 as losing this area will send us to heavy congestion near 63.7 and then potentially back to 63. Buying pressure continues to build beneath giving us these higher lows we see. The bullets below represent the likely shift of trading momentum at the positive or failed tests at the levels noted.
- Buying pressure intraday will likely strengthen with a positive retest of 64.86
- Selling pressure intraday will strengthen with a failed retest of 64.34
- Resistance sits near 64.78 to 65.17, with 65.78 and 66.2 above that.
- Support holds near 64.46 to 64.06, with 63.78 and 63.37 below that.
If you’re interested in the live trading room, it is now primarily stock market futures content, though we do track heavily traded stocks and their likely daily trajectories as well – we begin at 9am with a morning report and likely chart movements along with trade setups for the day.
As long as the trader keeps himself aware of support and resistance levels, risk can be very adequately managed to play in either direction as bottom picking remains a behavior pattern that is developing with value buyers and speculative traders.
Twitter: @AnneMarieTrades
The author trades stock market futures every day and may have a position in mentioned securities at the time of publication. Any opinions expressed herein are solely those of the author, and do not in any way represent the views or opinions of any other person or entity.


")