The Volatility Index (INDEXCBOE:VIX) and volatility futures are on the rise. This has caused the S&P 500 (INDEXSP:.INX) charts to whipsaw around. That said, prices were bought once more at its lower edges of congestion and lower highs are holding… for now. Trading ranges did expand – but with damp momentum, we are unable to assume that we will trend.
Gold and the 30-year treasury bond are holding their upper levels and are still in bullish formations.
Check out today’s economic calendar with a full rundown of releases. And note that the charts below are from our premium service at The Trading Book and are shared exclusively with See It Market readers.
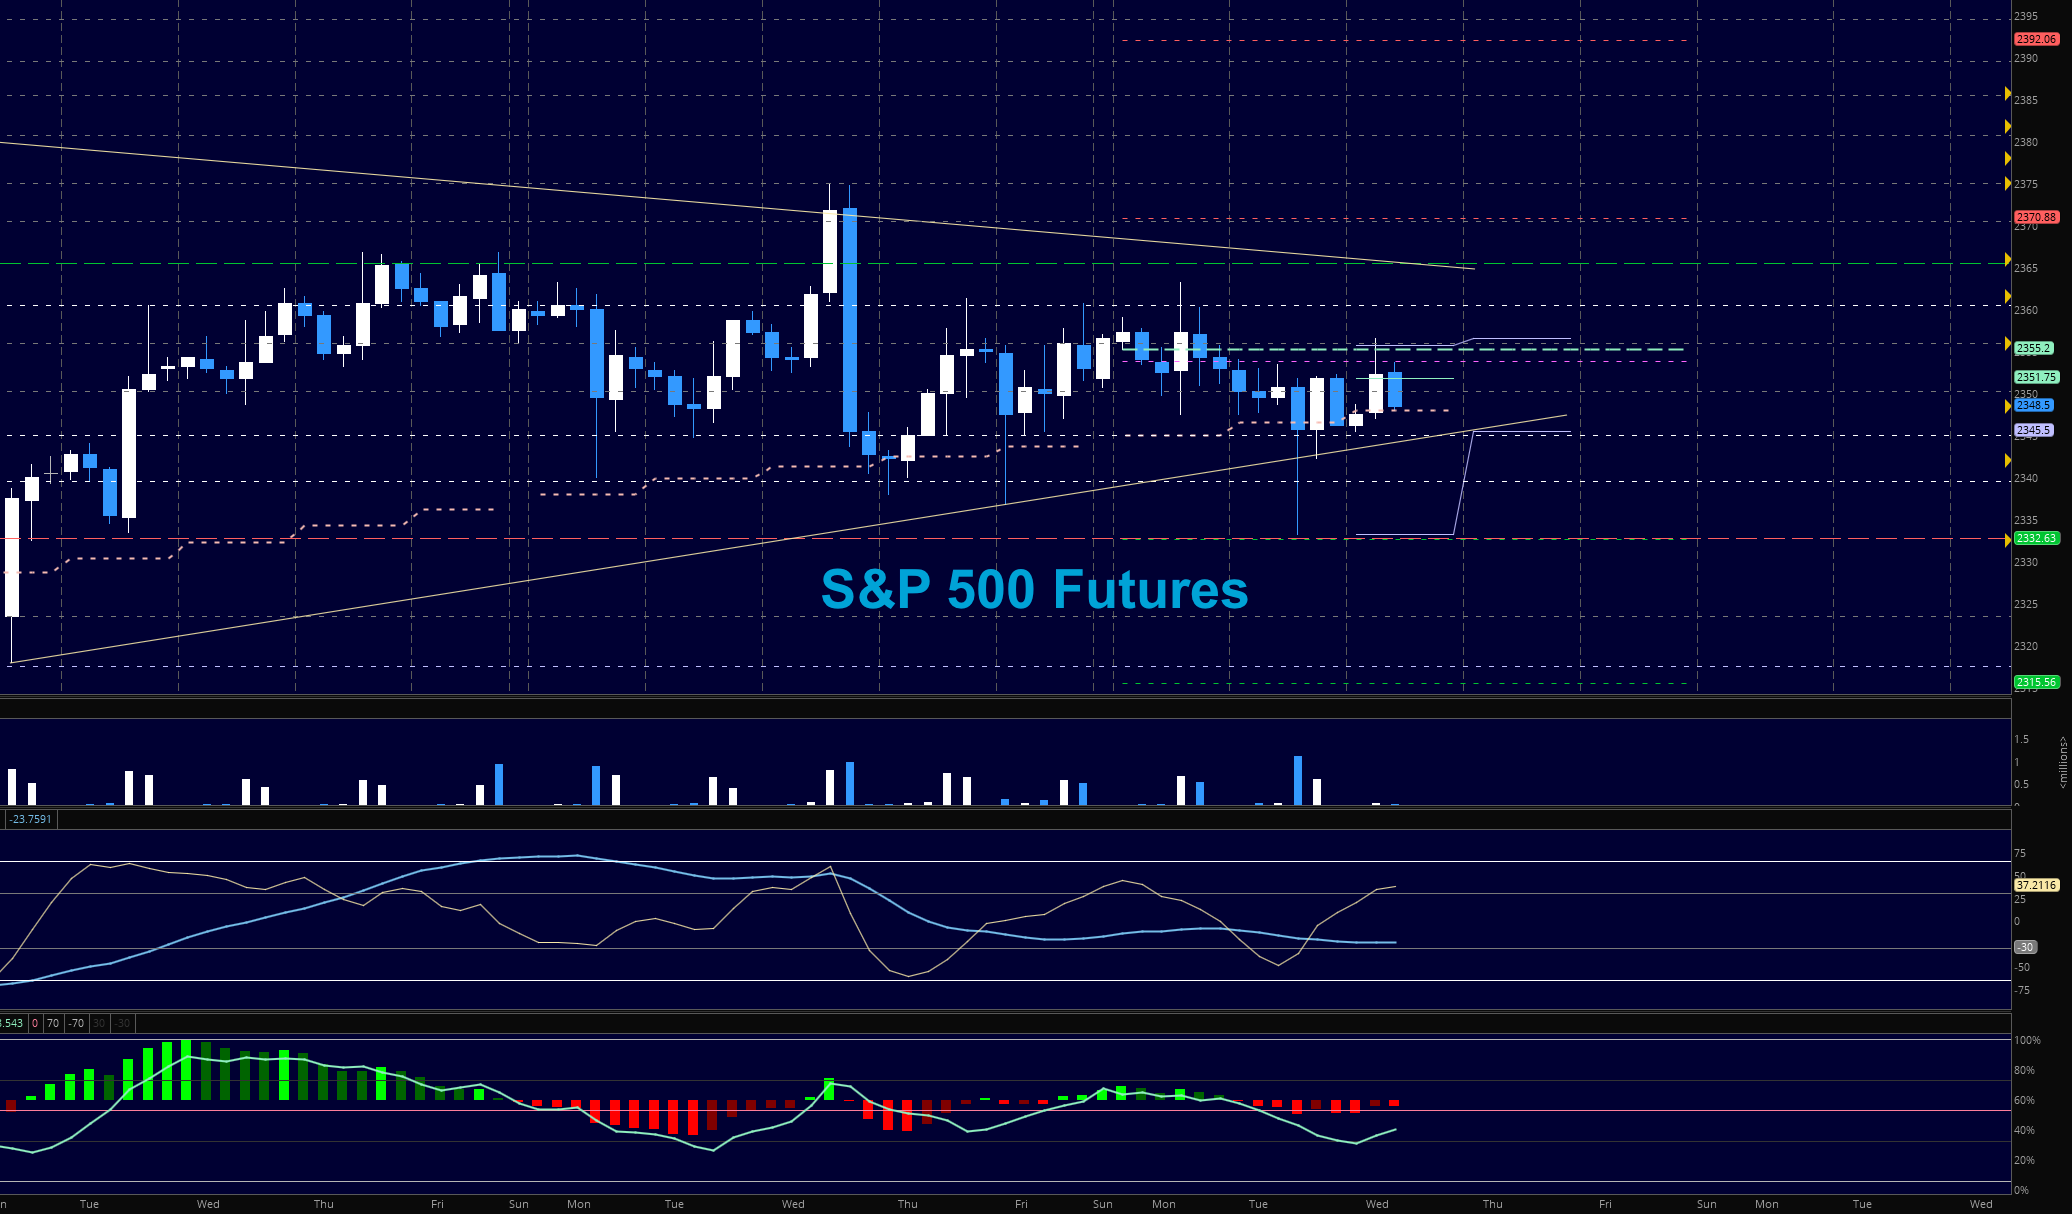
E-mini S&P 500 Futures (ES)
Momentum has been tepid and the trading range wide. Caution ahead, and for yet another day, managing size appropriately as whipsaws could easily continue will be primary.
- Buying pressure will likely strengthen above a positive retest of 2361.5 (but more resistance is ahead nearby)
- Selling pressure will likely strengthen with a failed retest of 2344.5
- Resistance sits near 2361.5 to 2365.75, with 2370.5 and 2376.25 above that
- Support holds between 2344.5 and 2339.5, with 2333.5 and 2323.5 below that
TRADING SETUPS
Upside trades – Two options for entry
- Positive retest of continuation level – 2356.75 (careful with resistance ahead)
- Positive retest of support level– 2346.5 (chart could also bounce near 2344.75)
- Opening targets ranges – 2349.75, 2353.5, 2356.25, 2359.75, 2361.5, 2366.25, 2367.5, 2372.75, 2375, 2377.5, 2381.5, 2385.75, 2389.75, 2392.5, 2396, 2400.5, 2404, 2411.75, 2423.25
Downside trades – Two options for entry
- Failed retest of resistance level – 2351.5 (watch for higher lows or a swift break above)
- Failed retest of support level – 2344.5
- Opening target ranges – 2348.75, 2345.75, 2344.5, 2341.75, 2336.25, 2332.75, 2328.75, 2325.75, 2320.5, 2317.75, 2313.75, 2307.75, 2304.75, 2299, 2293
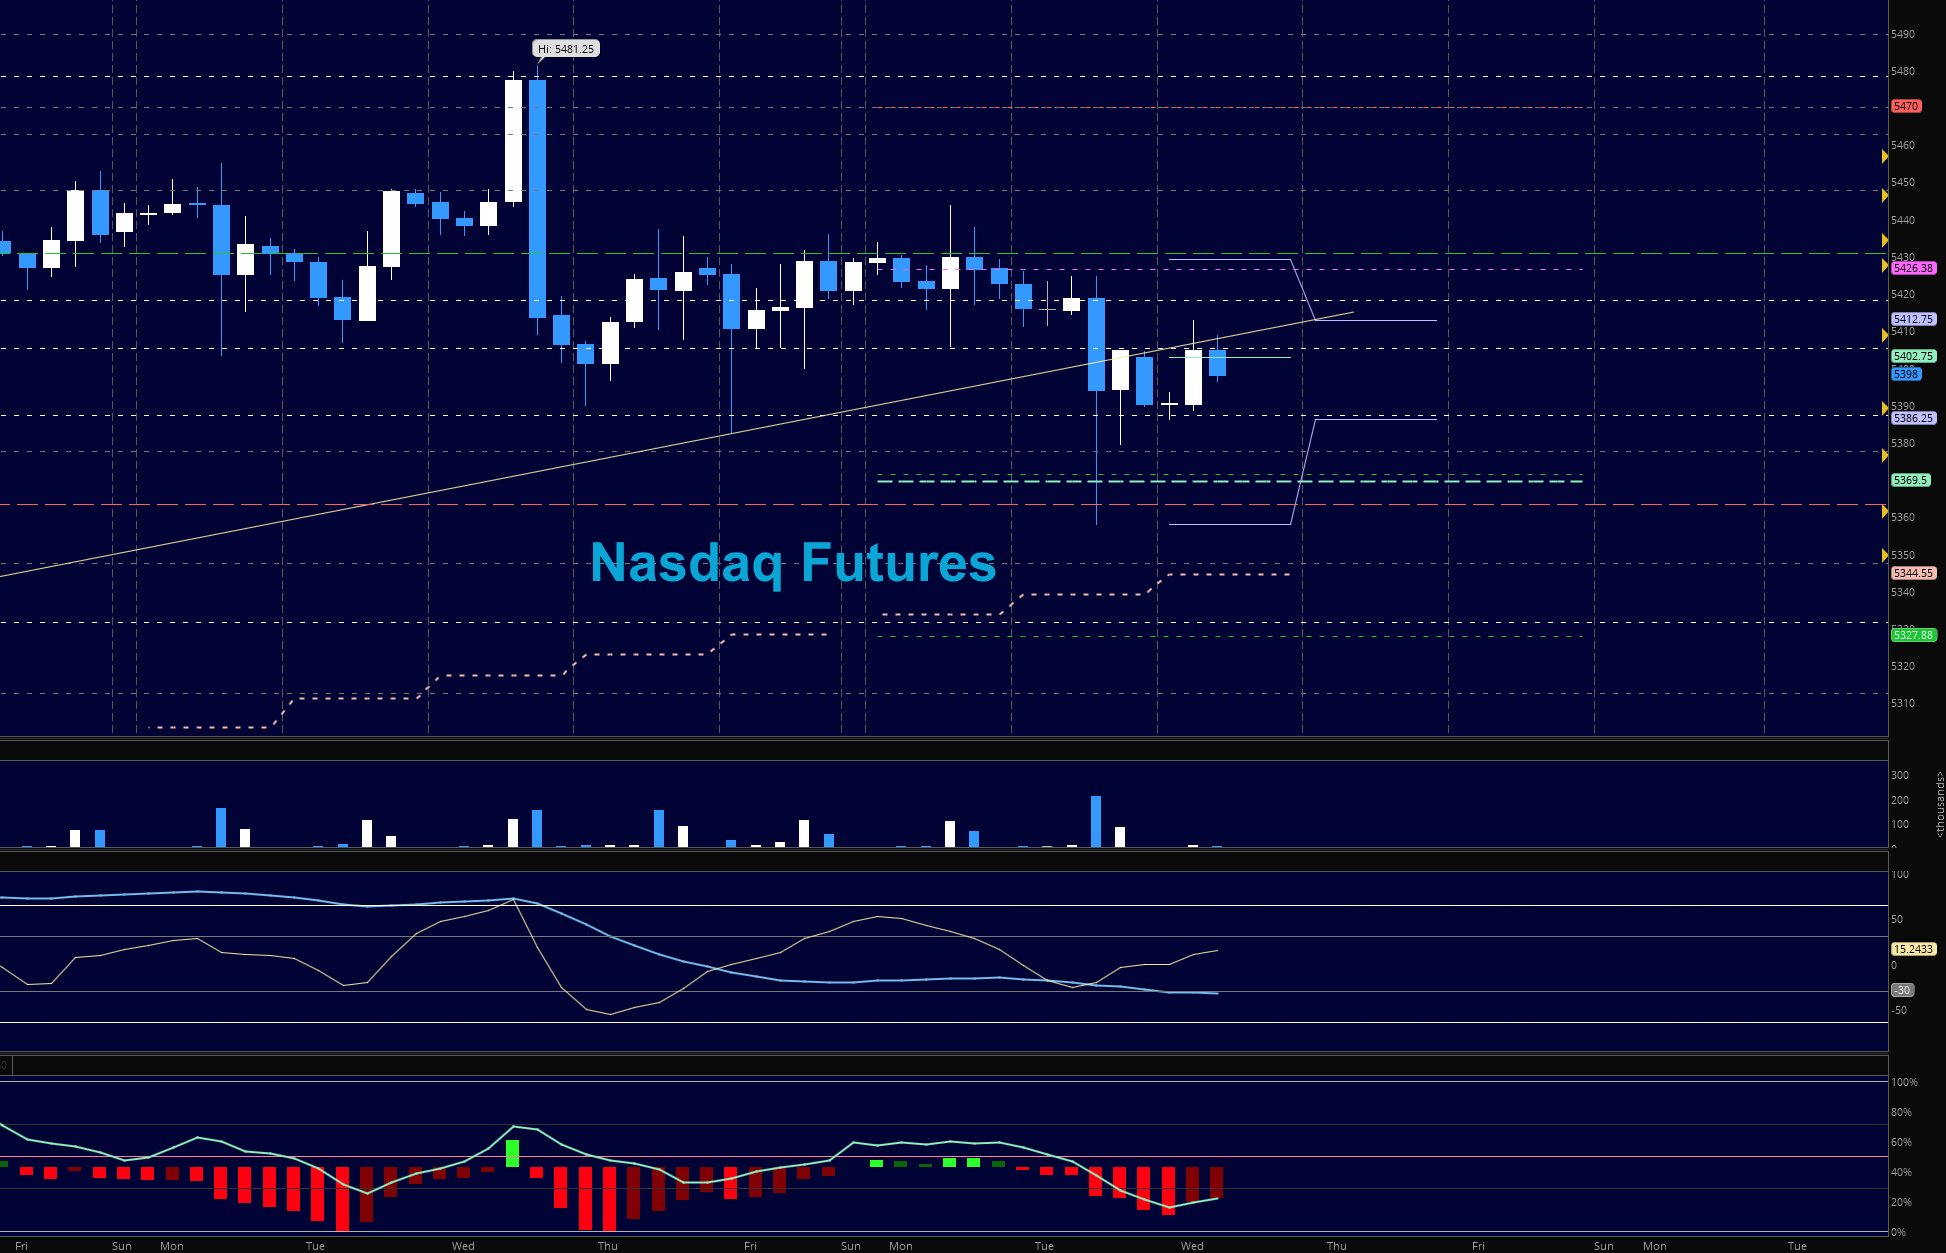
NASDAQ FUTURES (NQ)
Momentum continues to be adrift from bigger pictures, and this losing upside strength did allow the chart to dip below the lower zones presented at support. Cautionary tones are required and trading level to level will give us opportunities for gains within the range. We had both the deep pullbacks and the lower highs anticipated, but the recovery will be the recapture of 5434. Until then, we are still prone to selling.
- Buying pressure will likely strengthen with a positive retest of 5434.5 (use caution as sellers sit close by-wait for a retest)
- Selling pressure will likely strengthen with a failed retest of 5386.25
- Resistance sits near 5434.5 to 5443.75, with 5452.75 and 5478.25 above that
- Support holds between 5386.5 and 5378.5, with 5358.5 and 5347.5 below that
TRADING SETUPS
Upside trades – Two options
- Positive retest of continuation level – 5418.5 (make sure you have that positive retest and watch for the potential lower high)
- Positive retest of support level – 5395.5
- Opening target ranges – 5404.25, 5417.75, 5422.25, 5427.5, 5436.5, 5440.25, 5443.75, 5448.5, 5450.5, 5456.25, 5462.75, 5468.5, 5473.5
Downside trades- Two options
- Failed retest of resistance level – 5417.5 (watch for higher lows if chart is trying to move upward)
- Failed retest of support level – 5398.75
- Opening target ranges – 5411.75, 5407.5, 5404.75, 5399.25, 5394.5, 5389.25, 5377.5, 5369.5, 5363.5, 5358.75, 5347.75, 5344.75, 5338.5, 5327.5, 5318.75, 5312.75, 5306.5
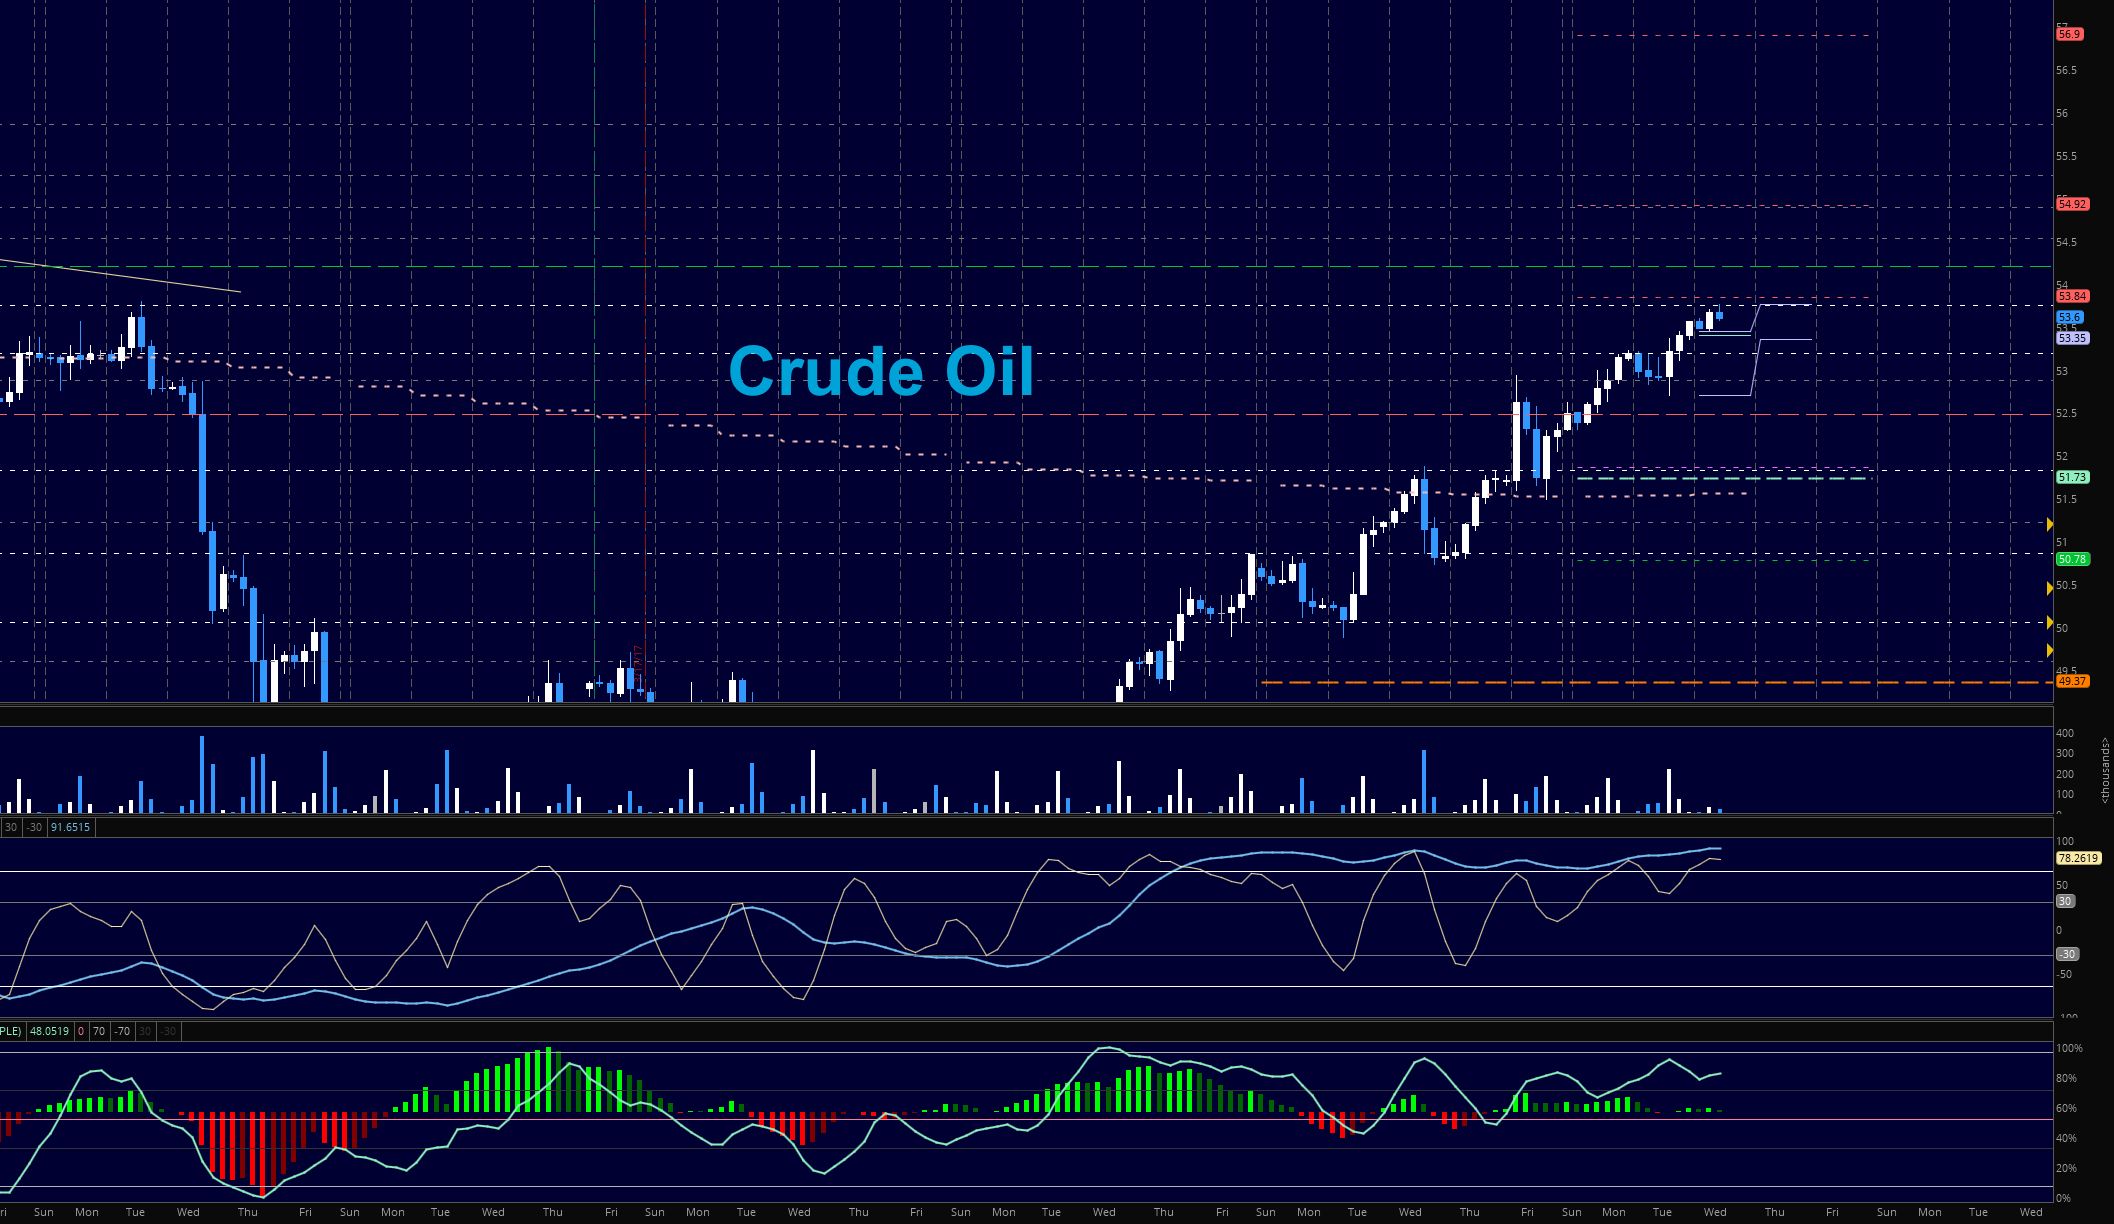
Crude Oil –WTI
Price continues upward motion into key areas of resistance near 53.76. The EIA report will be out today after the close. Charts suggest more upside is likely, and pullbacks will present buying opportunities.
- Buying pressure will likely strengthen with a positive retest of 53.76
- Selling pressure will strengthen with a failed retest of 51.54
- Resistance sits near 53.3 to 53.78, with 54.11 and 54.53 above that.
- Support holds between 52.84 and 51.54, with 50.88 and 50.26 below that
TRADING SETUPS
Upside trades – Two options
- Positive retest of continuation level – 53.76( could easily be resistance- use caution)
- Positive retest of support level – 53.25
- Opening target ranges – 53.38, 53.62, 53.74, 53.98, 54.11, 54.38, 54.89, 55.27, 55.68,
Downside trades – Two options
- Failed retest of resistance level -53.64 (watch for possible support building as chart is very bullish)
- Failed retest of support level– 53.3
- Opening target ranges – 53.26, 53.07, 52.84, 52.46, 52.29, 52.06, 51.85, 51.54, 51.23, 50.96, 50.78, 50.47, 50.23, 50.08, 49.88, 49.47, 49.2, 48.86, 48.62, 48.19
If you’re interested in watching these trades go live, join us in the live trading room from 9am to 11:30am each trading day. Visit TheTradingBook for more information.
Our live trading room is now primarily stock market futures content, though we do track heavily traded stocks and their likely daily trajectories as well – we begin at 9am with a morning report and likely chart movements along with trade setups for the day.
As long as the trader keeps himself aware of support and resistance levels, risk can be very adequately managed to play in either direction as bottom picking remains a behavior pattern that is developing with value buyers and speculative traders.
Twitter: @AnneMarieTrades
The author trades stock market futures every day and may have a position in mentioned securities at the time of publication. Any opinions expressed herein are solely those of the author, and do not in any way represent the views or opinions of any other person or entity.


