Over the past few weeks, several posts and analyses have emerged about market divergences, here and around the social blogosphere. From new highs vs new lows to small caps vs large caps to my kids average bedtime vs my trading performance.
You get the point: There are market divergences that highlight the market’s relative unhealthiness. And, don’t get me wrong, this is very important to stay on top of, but at the same time much of this is known and has been out there for a while.
So how will this play out? Well I think it’s been playing out for some time. The market has been uncertain for several weeks, and that’s okay. Earlier today, Brett Steenbarger posted a historical study highlighting periods where pronounced market divergences emerged. Contrary to conventional wisdom, the market often advanced in the weeks thereafter.
Just as we see price discovery to the down side, we have it playing out to the upside. Investors are feeling out their risk tolerance and rotating assets into classes that feel comfortable. When this rotation isn’t clean and timely, the market looks (and feels) messy. In a late April S&P 500 technical update, I wrote about this uncertainty:
As the market chop continues, so does the uncertainty. This isn’t necessarily a bad thing (nor a good thing). It just means that market participants are trying to figure out how to rotate/invest their capital. In my humble opinion, the market still has room to the upside and the downside. Which comes first will depend on whether the trend breaks down, or re-emerges. And this depends on how well the technical levels hold up.
I also noted that neither the TLT nor VIX “are lighting the world on fire, but they are indicative of a choppy market.” This type of language may sound a complacent, but I’d argue that it’s more about being aware than firming up a belief that the market is about to head significantly lower. It’s clear that there are reasons for caution and this is being reflected through investors actions (i.e. rotating into safer forms of risk). But the market is still holding above key technical support levels (and at or near all-time highs). Timing any type of market pullback is difficult, let alone a deep correction. Lightening up and waiting for confirmation is usually a better way to keep your psychology fresh (and powder dry).
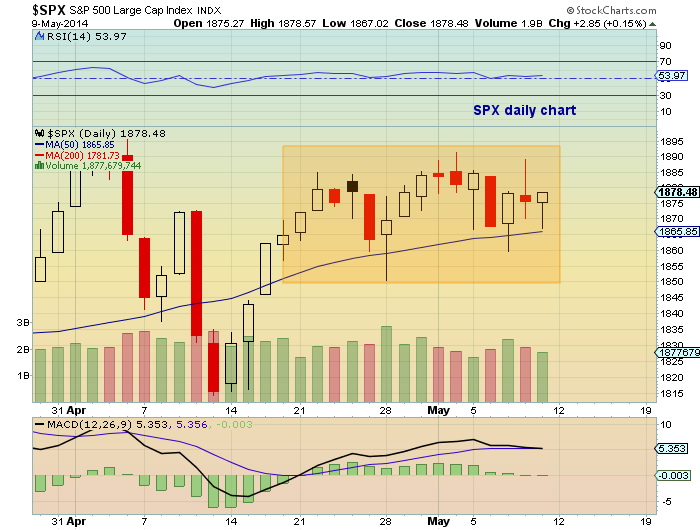
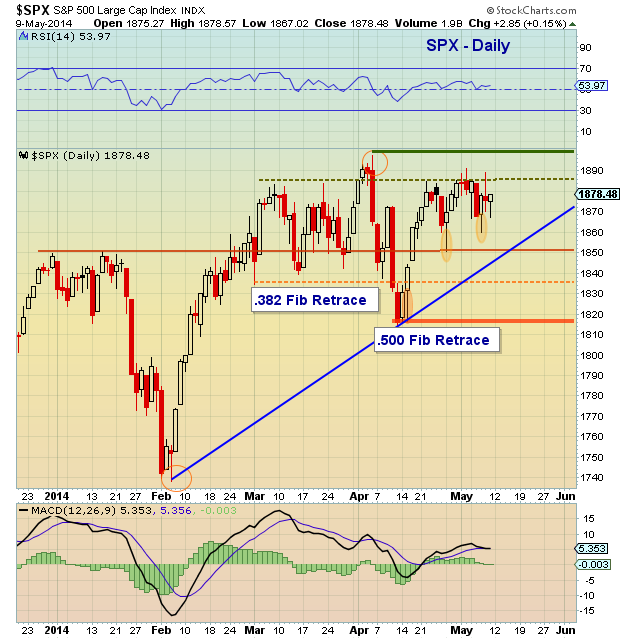
Following price is all I care about. Below are two S&P 500 charts highlighting the uncertainty that is showing up in prices each day – just look at the “tails” on those candles. The second chart below looks at some near-term technical levels to be aware of.
S&P 500 Daily Chart – Uncertainty
S&P 500 Near-Term Technical levels
Circling back to the current market divergences: Should stocks head lower, it will be interesting to see how Blue Chips hold up, especially if Small Cap contagion infects large caps.
Just for kicks, my current outlook sees both higher highs and lows. This could play out with a market rally that sees Small Caps and momo stocks bounce (perhaps of the dead cat variety), followed by a choppy move lower this summer. A possible range of 1740 to 2000 could be seen during summer (into fall), with uncertainty giving way to a 10 percent plus correction. Trade safe.
No position in any of the mentioned securities at the time of publication. Any opinions expressed herein are solely those of the author, and do not in any way represent the views or opinions of any other person or entity.


: Showing Some Signs of Emerging Strength")
