By Alex Bernal
In an effort to expand upon my collection of market cycles work, I thought I would showcase a simple study on the past few market cycle tops in the S&P 500 (SPX). I will also attempt to show that while composite market cycles don’t always hit at the exact market top, they are still very useful in mapping out a forecast of market direction.
In the chart below, I have added vertical lines at the past 3 cycle market tops. Using the SPX price as a backdrop, these cycle tops assist in highlighting cycle timing in accordance with market price.
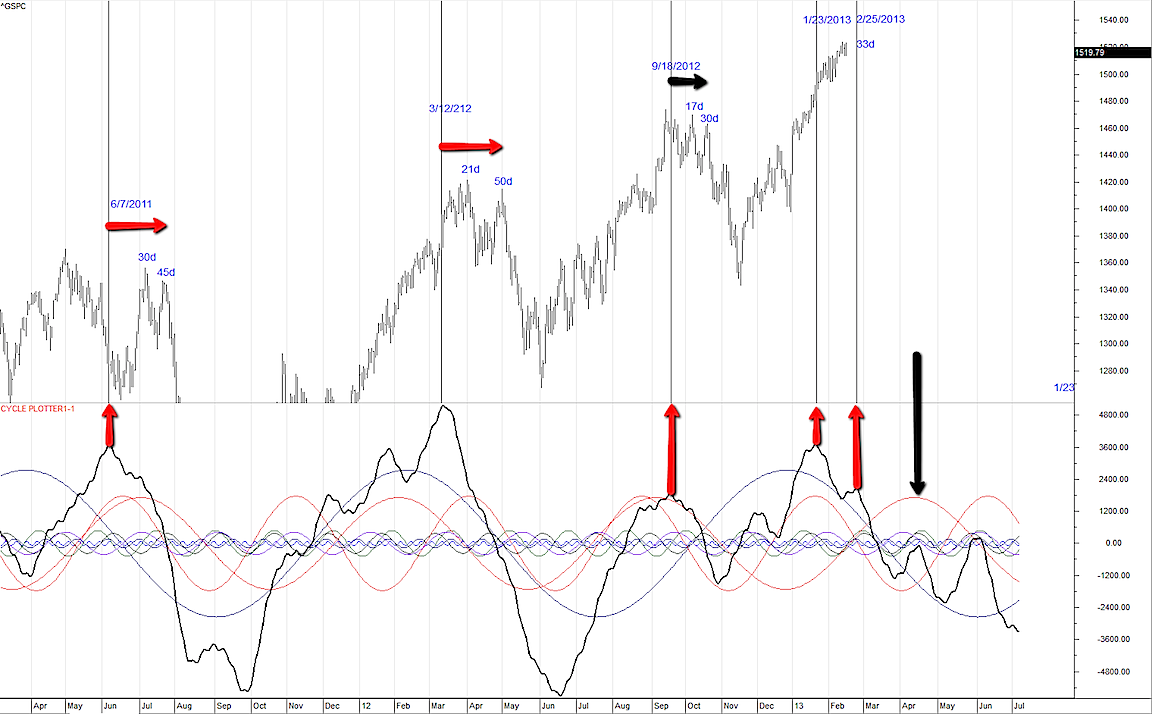
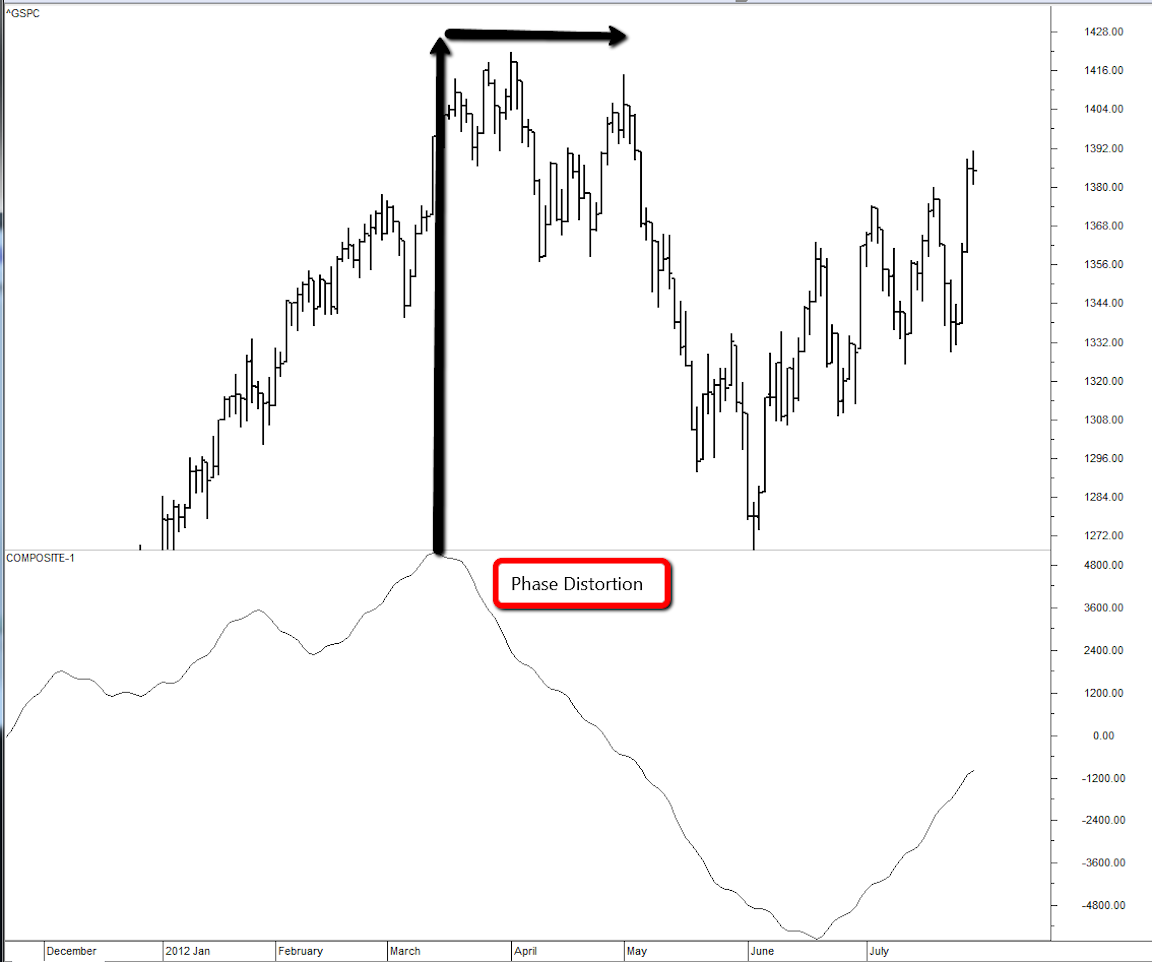
As you can see, the price action did not hit an exact market cycle top at these node points. However, after the phase harmonics of the underlying market cycles combined, we saw a follow through in the forecasted direction. I always use the game “Crack the Whip” as an example for this type of reaction; as the lead person in the chain takes a sharp turn there is a lag effect in time and in location whereby the last person on the whip sees no change in direction initially and then all of a sudden gets yanked in the new direction along with the rest of the whip. This lost motion (in time and location) or sudden phase effect is always present in cycles and can be somewhat summarized with the Stress Wave Theory of Harmonics.
This theory has been developed by physicist Tom Bearden & can be crudely summarized as follows.
Logical & Traditional mathematical expectations would assume that 2 cycles with 180 degree phases (opposite locations of peaks and troughs) would cancel each other out and you would see a flat line or muted affect in the underlying movement (energy) at that particular time. See diagram below. Source: Dan Davidson’s book Shape Power)
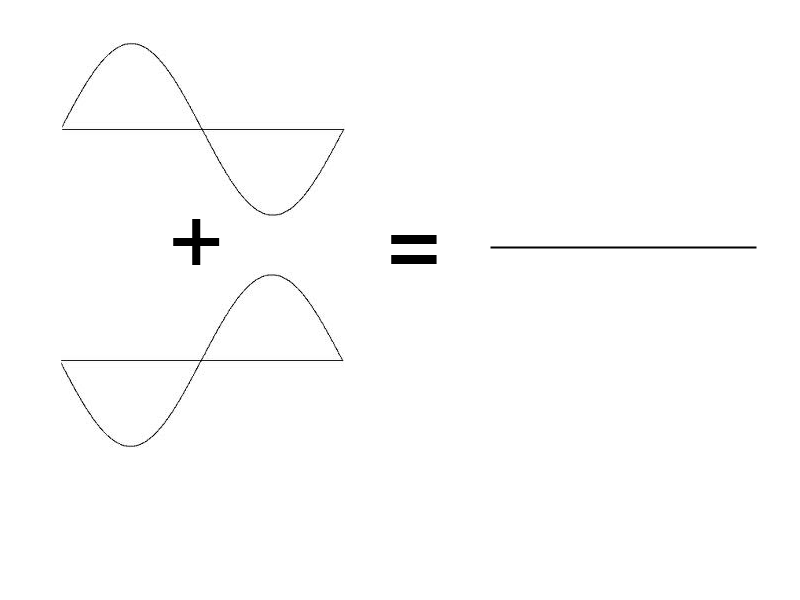
In a certain sense, this is not really possible due to complex laws of physics that I won’t get into here. However, an alternative way to look at the possible outcome of two 180 phase cycles can be seen in the diagram below. Source: Dan Davidson’s Shape Power.
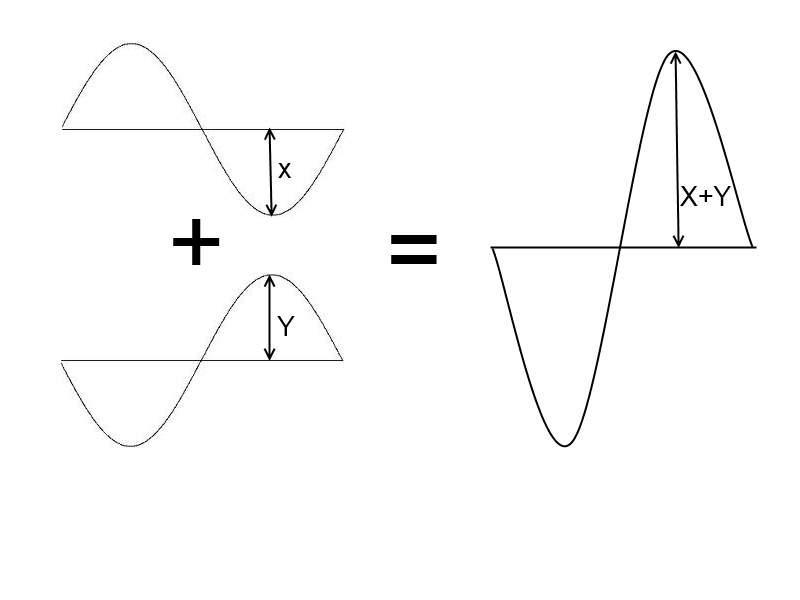
Here the summation of two cycles energy’s does not collapse to zero but instead creates a “scalar” stress wave in which the combined forces compress without the loss of energy, only to be released to greater amplitude of their original form. This affect is difficult to visualize in price charts but can possibly lend explanation to why we sometimes see market cycles “disappear” & “reappear.” This compound effect of both cycles on each other amplifies a given direction, and because we very rarely see perfect 180 degree phase cycles (perfectly opposite each other), this is how I explain this extension in time from the peak of the cycle to the peak of the actual price action.
You can see in the below diagram that even with the harmonic analysis of two simple cycles we can have noticeably different combined wave forms with just the slightest change in phase (180 degrees). Source: Dan Davidson’s Shape Power.
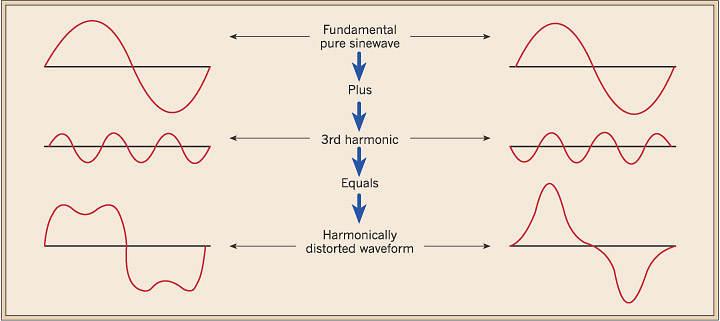
In conclusion, there are a multitude of different cycles involved with markets and they are very rarely aligned in perfect harmonics (as in the above diagram). It is no wonder why we get such complex and dynamic market movements.
SPX Update : I am still projecting a major market high and have noticed the underlying cycles in the SPX & Volatility Index are starting to suggest that this “crack the whip effect” to the downside could come to fruition on or before March 1. I also want to stress that I believe in waiting for “technical confirmations” before making any trading decisions. Blindly selling tops and buying bottoms is not recommended with any trading system or with this analysis technique but rather best used as a complimentary signal.
Disclaimer: This in no way constitutes investing advice. All of these opinions are my own and I am simply sharing them. I am not trying to convince anybody to do anything with their money. I am simply offering up ideas for the sake of discussion. As always, everybody is expected to do their own due diligence and to ultimately be comfortable with their own investing decisions. Any actions taken based on the views expressed in this blog are solely the responsibility of the user. In no event will Aether Analytics or its owner be liable for any decision made or action taken by you based upon the information and/or opinion provided in this blog.
Twitter: @InterestRateArb and @seeitmarket
Author has a position Short OTM Call spreads and OTM Put Calendars Spreads in SPX at the time of publication.
Any opinions expressed herein are solely those of the author, and do not in any way represent the views or opinions of any other person or entity.


 Testing Important Price Support")
")
