The global economy continues to recover from the pandemic-induced recession. That being said, the pace of the recovery appears to be slowing. Comparables are becoming a bit more challenging as we move into Q3 given Q2 2020 was the worst of it, from an economic perspective. The delta variant is providing some headwinds as well.
Neither delta nor a bit of data normalization will derail this recovery; the pace is strong. Some smaller central banks have started to pivot away from stimulus, but the biggies remain with taps pretty wide open. The consumer, with so much excess saving accumulated during the lockdown periods and pent up demand to live, is out and spending freely.
Anecdotally, a prominent Canadian restauranteur noted the desire of patrons to spend money has never been greater. And that is Canada. A peer who recently visited Vegas noted that it wasn’t just full, he had never seen table minimums set higher during any of his many previous visits.
The economic momentum is being felt on company bottom lines. The Q2 earnings season has been a healthy one showing that even optimistic consensus estimates can be bested. The earnings surprise rate remains historically elevated. Earnings growth and momentum is increasingly important as this does help alleviate elevated valuations. High valuations have remained a sore spot in our Market Cycle indicators.
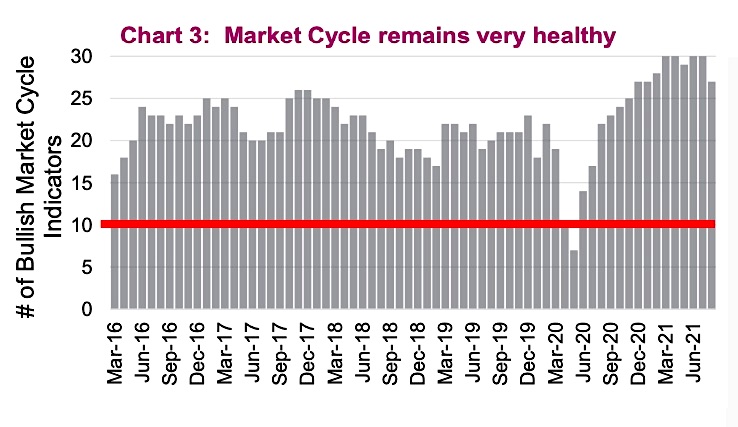
The number of positive indicators has slipped this month. Valuations and a flattening yield curve remained bearish from before and have been so for months. Joining on the bearish side are U.S. car sales. Fear of public transit is contributing to auto demand, plus this was an area the consumer could spend money on with limited contact with others. They even deliver now. However, after running at very elevated levels for months, the pace appear to be normalizing. Supply bottlenecks are likely contributing to the slower pace as well.
The other notable bearish signal came from emerging market (EM) index performance. EM, which has a hefty weighting to Chinese equities, roughly reached correction territory representing a 10% decline. China has been cracking down on technology companies of which its index has a high weighting. We do not believe this represents a risk to the broader market.
Inflation remains the big question out there and the data will continue to be noisy. Headline inflation, which has jumped higher on a number of categories affected by the pandemic/recovery, should normalize over the next few months. However, beneath the headline, inflation is building across many categories. Just ask anybody who has bought something or tried to hire someone.
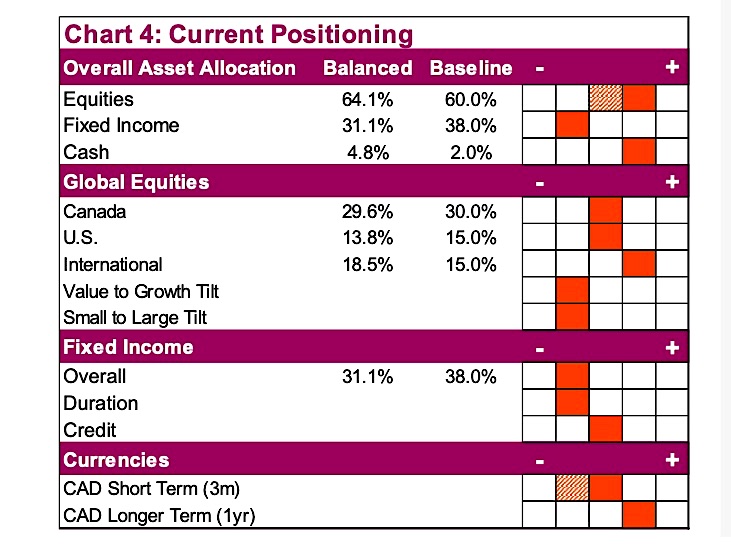
We continue to have a slight tilt towards equities, lifted a bit higher due to our rules-based tactical component. Equity-wise, we continue to prefer international, then Canada, then U.S., remaining underweight on bonds with low duration. After the CAD’s recent tumble we have returned to neutral in the short term.
Source: Charts are sourced to Bloomberg L.P. and Richardson Wealth unless otherwise noted.
Twitter: @ConnectedWealth
Any opinions expressed herein are solely those of the authors, and do not in any way represent the views or opinions of any other person or entity.

: Showing Some Signs of Emerging Strength")
