Mystery Indicator “monthly” Chart – Opportunity?
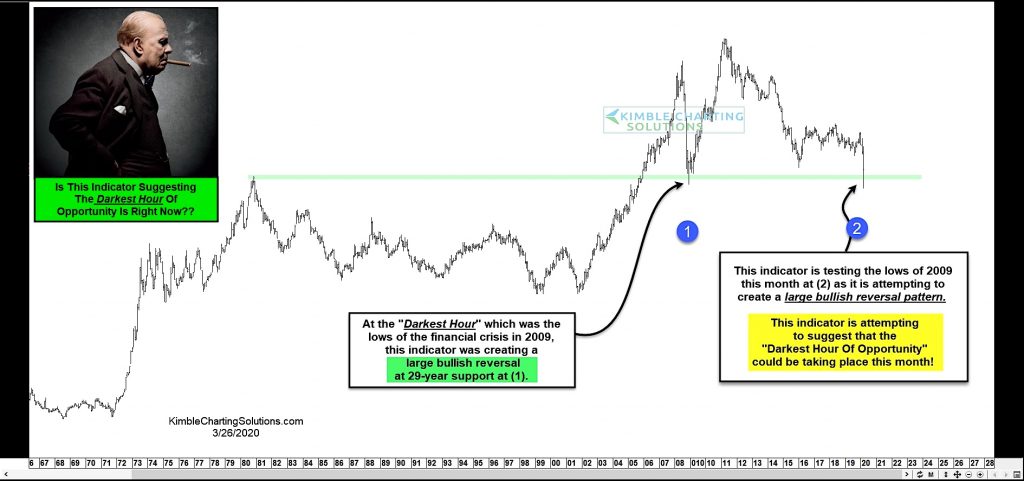
Today’s chart is an indicator that I track and share with clients, so I won’t disclose it other than sharing its relevance to the last financial crisis.
I want to simply point out the pattern without bias. Note that it is a “monthly” bar chart.
During the lows of the financial crisis in 2009, this indicator created a large bullish reversal (falling sharply before reversing higher to end the month) at long-term support at (1).
Fast forward to today, and this indicator is testing the lows from 2009 at (2) and attempting to create a similarly large reversal pattern once again.
Could this be highlighting that we are near that “dark hour” of opportunity again?
Note that KimbleCharting is offering a 2 week Free trial to See It Market readers. Just send me an email to services@kimblechartingsolutions.com for details to get set up.
Twitter: @KimbleCharting
Any opinions expressed herein are solely those of the author, and do not in any way represent the views or opinions of any other person or entity.


