Generally, the major stock market indices all look about the same so it’s a bit fruitless to analyze all of them every single week. Our focus has always been on the S&P 500 as that is the world’s benchmark for equities. Some interesting differences have cropped up during the last couple of months, though, so this is a great time to look at the other stock market indices we follow. Below is a graphic showing relative strength and weakness I am following in the market.
Market divergences between the main stock indexes can at times be very telling, so let’s dig in.
During a bull market, it is very important to find leadership in the higher beta, growth stocks as well as higher beta stock market indices such as the NASDAQ 100 and the Russell 2000. On the flip side, when the mega cap stocks are leading and/or defensive sectors such as Consumer Staples, Utilities, and Telecom, you have to be on the lookout for trouble in the overall market.
Prior to the market’s decline late this summer, I pointed out that the large, mega cap stocks were outperforming their smaller peers by a wide margin. This was a warning sign for the overall market. I also pointed out the relative weakness in the Dow Jones Transportation Average, which many ignored. These were both great caution flags with multi‐month lead times for the market. However, these types of setups can also backfire. In June and July, both the NASDAQ 100 and the Russell 2000 broke out to new highs after a period of basing. The problem was that these indices were being led by their largest components and not by a broad base of stocks from diverse sectors.
Please note that part of this analysis was provided as an update to my subscribers late last week and since then I’ve been traveling. Therefore, these charts have not been updated (but still remain relevant).
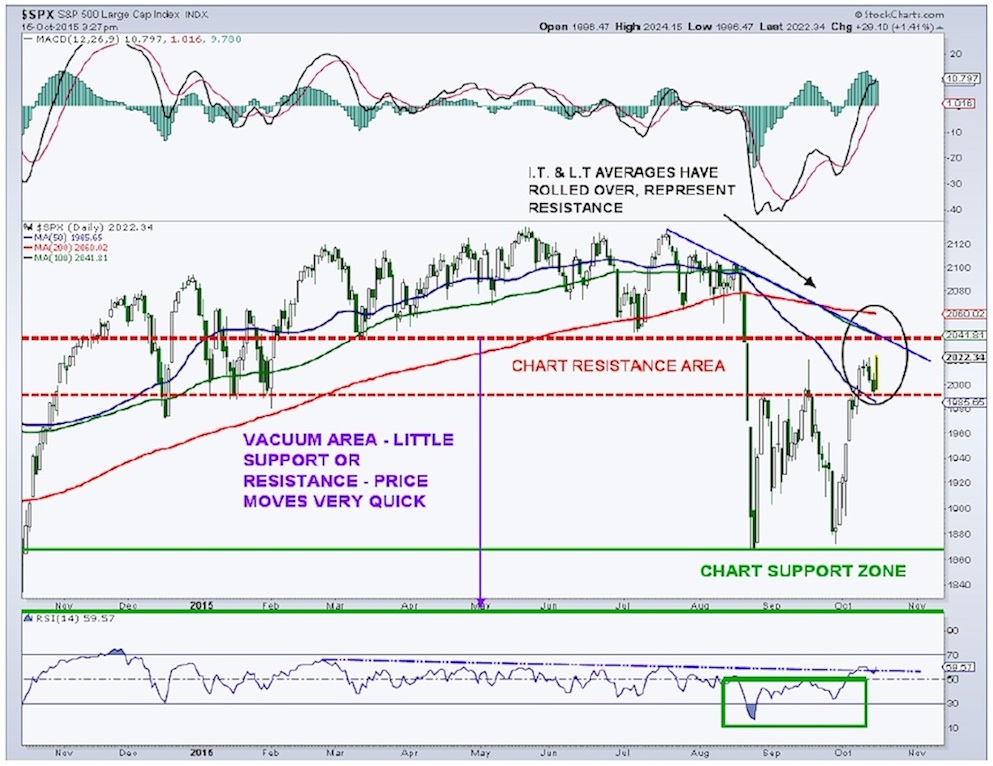
Let’s start by looking at the S&P 500 (see chart below). The index remains in the upper part of its range. So far, this looks like a nice backtest of previously key support levels before the next move higher. Intraday momentum has reset from overbought to neutral, so it looks like the index is poised for a run up to the next key price resistance zone at 2,040.
There is also trendline resistance near 2,040, drawn off the highs since July. That will be a key test for the S&P 500 as it represents the breakdown level before the mini panic. Price resistance starts at 2,040 and runs back to the May highs at 2,135. The slowly falling 200-day moving average, also potential resistance, is near 2,060. Daily momentum is bullish as the MACD has moved into positive territory while the 14-Day RSI is attempting to break an almost 8 month downtrend.
On the downside, as I said last week, it is really difficult to point out chart support between current prices and the recent lows near 1,870 because the price action has been so fast. There is a vacuum area on the chart where there is little in the way of definable support and resistance levels. Below 1,990, there is a gap on the S&P 500 chart down in the 1,952/1953 zone that could act as support.
S&P 500 Daily CHART – Headed Into Resistance
The Russell 2000, on the other hand, is struggling vs. the S&P 500, and this pattern of relative weakness goes back to late June. The Russell 2000 traced out a lower low while the S&P 500 did not. The index remains over 4% below its Sept. 17 peak while the S&P 500 is less than 1% from this “FED Day” peak.
continue reading on the next page…


