Over the past few weeks the markets have been pretty stagnant, almost lifeless, not really moving much in either direction. This repeated lack of activity day after day is known as consolidation and has created a small 20-pt range in the E-mini S&P 500. This will eventually lead to a market breakout or breakdown.
That said, trading within a consolidation period such as this can be challenging at best. Lots of whipsaw action, short-lived trends, and constant changes in direction. Often times we see days where the market closes right about where it opened.
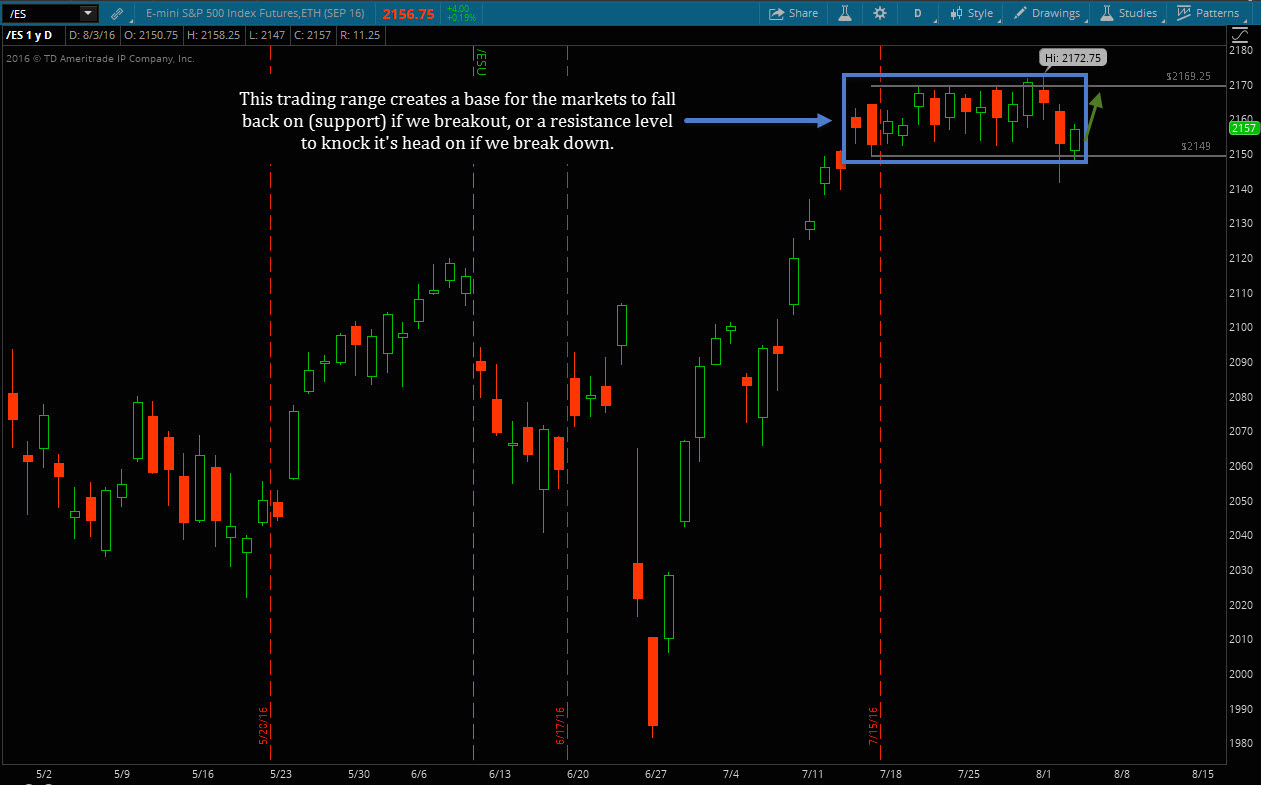
The good news, is that these consolidation periods do a nice job of establishing new support and resistance levels. Simply put, an area that can hold the market up (support below), or pressure that can keep the market from moving higher (resistance above).
Once the market breaks out of the consolidation area, trading often picks up and we see more directional candles on the daily chart which, in turn means more intraday opportunities.
So keep an eye on the E-mini S&P $2150 – $2170 level and if we break out (upwards) look to the upper end of this most recent consolidation ($2170) to act as support. If we break down, look to the lower edge ($2150) to act as resistance.
Thanks for reading.
Twitter: @EminiMind
The author trades stock market futures and may have a position in mentioned securities at the time of publication. Any opinions expressed herein are solely those of the author, and do not in any way represent the views or opinions of any other person or entity.
: Creating Bullish Divergence?")


 and Semiconductors (SMH): Concerning Price Pattern?")


