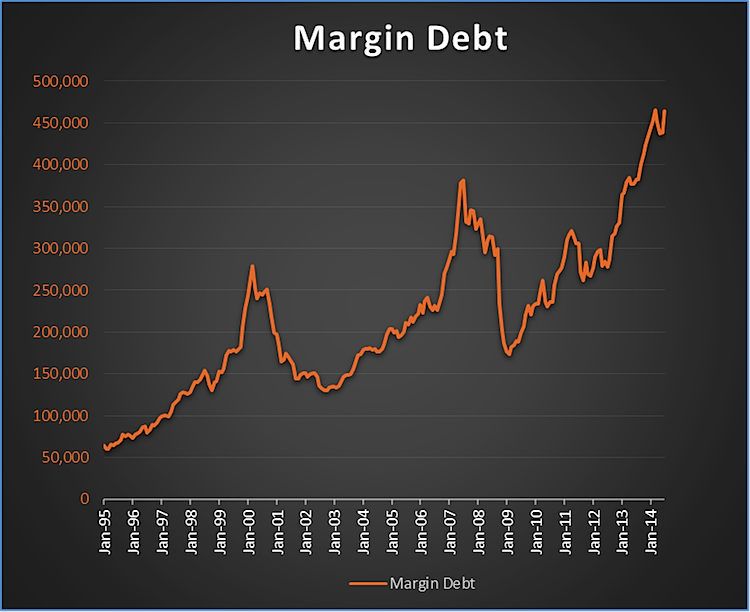
NYSE margin debt for June just came out and it surged 5.9% from May and is now just 0.3% away from the March peak. Let’s dig into the data and see if this is reason for investor concern.
Margin Debt Since 1995
Margin debt has long been used as a contrarian indicator over the years, with the thinking being once everyone is on margin this is a sign of too much optimism. Then if we start seeing some selling, this will lead to margin calls and more selling. Eventually ending in a market crash.
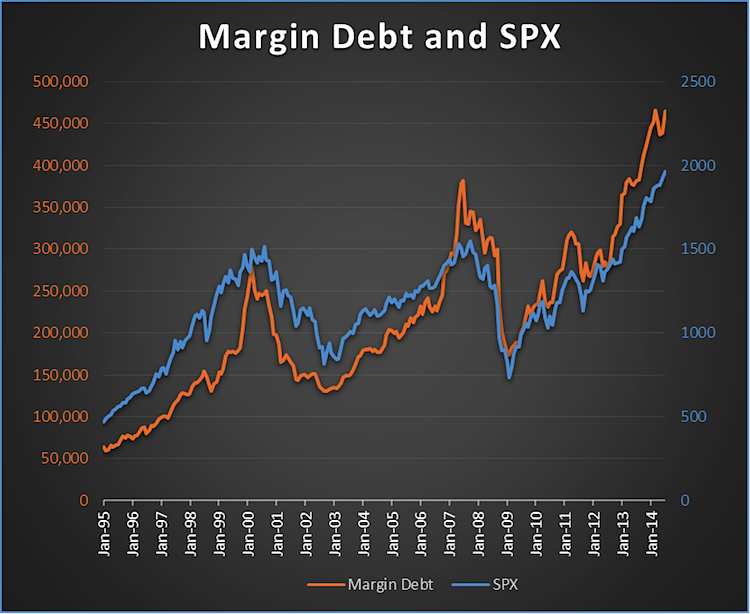
Going back to 1995, there has been an 89% correlation between margin debt and the S&P 500 (SPX). This chart below tells the story.
Margin Debt vs S&P 500 Since 1995
Now my big problem with margin debt is so many have been using it as a contrarian warning for the past year, all the while we’ve had a massive bull market. It was just over a year ago we first started to hear that margin debt was ‘too high’ as it broke above the 2007 peak. My big argument then, as it is now, is the trend of margin debt is much more important than the absolute level.
Here’s some proof that new all-time highs in margin debt happen quite often. Since 1981, there have been 402 months and it made a new high 101 times. That is 25% of the time margin debt is making a new high. So the next time you hear someone say margin debt is making a new high and this is ‘bearish’ you can point out it is rather common and isn’t a big worry. Again, the bigger worry is should it start to rollover, then I’d be concerned.
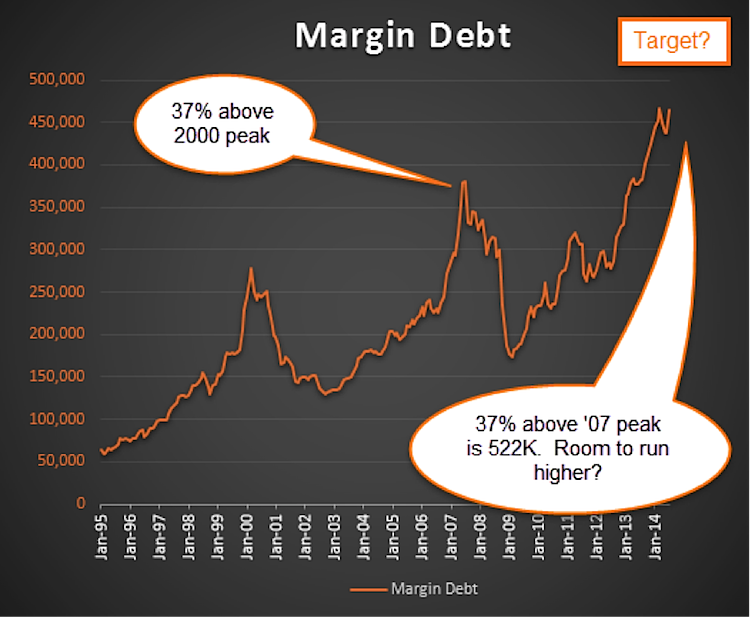
Lastly, could there be more room for margin debt to move higher? I sure think so. In fact, the 2007 peak was 37% above the 2000 peak. Adding 37% to the 2007 peak gives plenty of room to move higher, per the chart below.
Is Margin Debt Peaking Again?
Margin debt is just one of the many sentiment indicators I follow. Everyone loves to point out how margin debt peaked right at the 2000 and 2007 stock market tops, but what they seem to leave out is it made a bunch of new highs before the eventual peak. Don’t be a hero, it could continue to move higher for years for all I know. Just be ready once it starts to rollover.
Follow Ryan on Twitter: @RyanDetrick
No position in any of the mentioned securities at the time of publication. Any opinions expressed herein are solely those of the author, and do not in any way represent the views or opinions of any other person or entity.
: Creating Bullish Divergence?")


 and Semiconductors (SMH): Concerning Price Pattern?")


