The March 17 stock market futures outlook focuses on lower support levels after charts bounced higher on the Federal Reserve announcement yesterday, before pulling back. Momentum was not strong enough to hold the levels above. We will now look to lower support levels.
Remember that it’s OPEX week.
The Morning Report: Futures Still battling Congestion
The S&P 500 futures chart highlights supportive congestion near 2005-2010. This comes after S&P 500 futures receded from the highs after the Fed meeting. Support to defend is near 2011.5, but we’ve broken it once. Buyers have to quickly recapture 2017 to continue north into the retest of the highs, else we see the retest of 2005 and below.
Momentum on the four hour chart is positive, but divergent relative to price –slope of trend suggests buyers will still show up at key support levels near 2005 to 2001.
Traders should be mindful of the potential for lower highs developing on March 17 stock market futures… especially if sellers gain momentum and continue to force price off the prior day’s high.
Shorter time frame momentum indicators are sloping down, but momentum is still positive.
See today’s economic calendar with a rundown of releases.
THE RANGE OF THURSDAY’S MOTION
Crude Oil Futures (CL_F)
The contract roll on crude oil futures has the chart gapping up- this normally creates a reversal event that brings new prices into old ones, before moving forward.
Today, the trading ranges for crude oil futures are between 39.4 and 41.6.Breaks of these levels are likely retrace before moving again.
Moving averages in oil show mixed to slightly negative momentum on longer time frames. Support levels near 39.4 to 39.06 need to hold for buyers to continue to hold the power to rise. Resistance sits near 42.40 – it seems buyers have their eyes on that level above.
Intraday long trading setups for crude oil suggest a long off 40.3 positive retest (check momentum here), or 39.4 bounce and positive retest into 39.89, 40.1, 40.45, 40.87, 41.15, 41.62; and if buyers hold on, we’ll see 42.2 to potentially 42.87.
Intraday short trading setups suggest a short below a 40.1 failed retest with negative divergence, or the failed retest of 40.87 sends us back through targets at 39.67, 39.4, 39.1, 38.9, 38.69, and back into familiar regions seen near 38.25 to 37.94 if sellers hang on.
Have a look at the Fibonacci levels marked in the blog for more targets.
E-mini S&P 500 Futures (ES_F)
Below is a S&P 500 futures chart with price support and resistance trading levels for today. Click to enlarge.
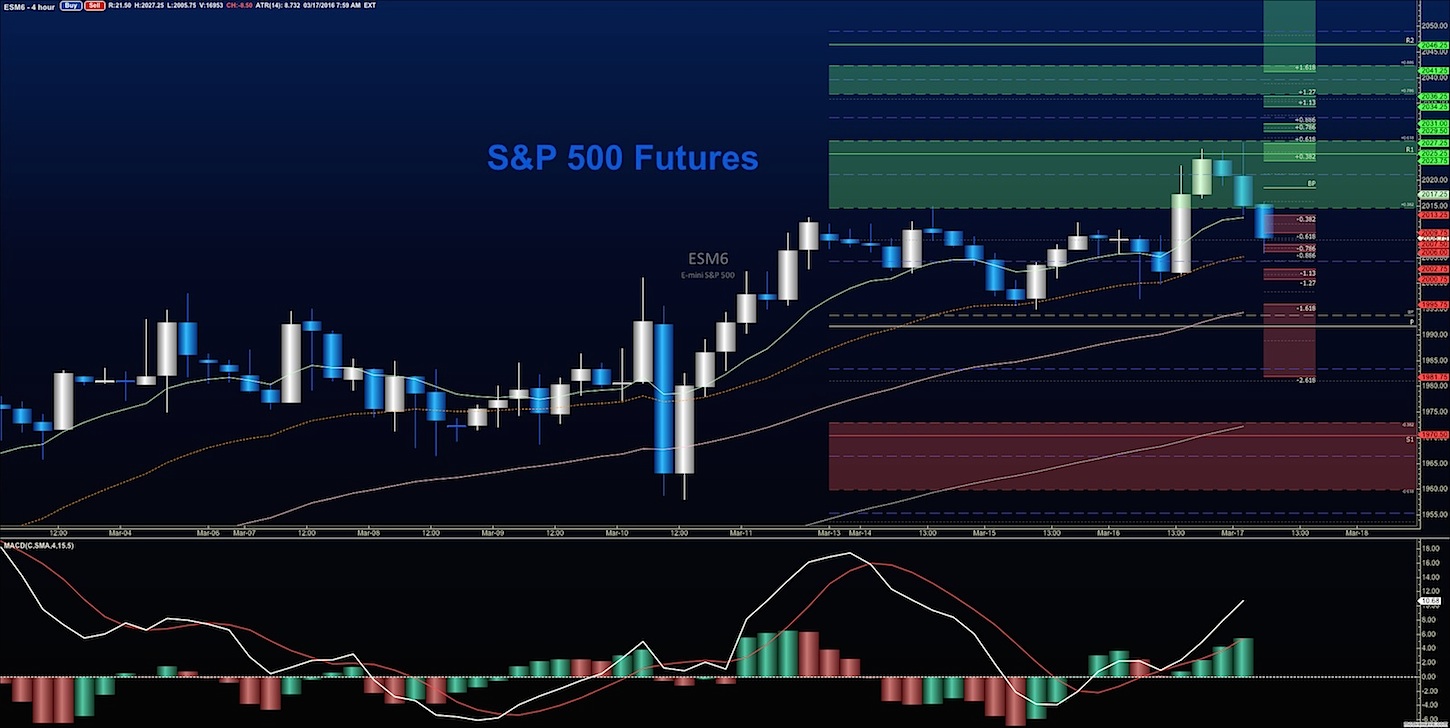
The big bounce on the S&P 500 futures after the Fed announcement could not hold at first attempt. Congestion between 2005-2010 will be the region buyers will need to defend as support. 2017-2019 serves as front line resistance, with 2021-2027 as secondary congestion and resistance.
Upside motion has the best setup on the positive retest of 2011.5 or a bounce off 2006.25 with positive momentum. I use the 30min to 1hr chart for the breach and retest mechanic. Targets from 2006.25 are 2007.5, 2010.25, 2012, 2015.5, 2017, and if we can catch a bid there, we could expand into 2019, 2021.25, 2023, and 2026.5. The next resistance tests remain between 2021-2027. Watch the higher lows to keep you on the right side of the long trade.
Downside motion opens below the failed retest of 2005 or at the failed retest of 2010 with negative divergence. Retracement into lower levels from 2010 gives us the targets 2007.5, 2005.25, 2002.25, 2000.5, 1997.25, 1994.25, 1991.5, 1987.75, and perhaps 1984.5 if selling really takes hold, but that still seems quite unlikely at this point in the day.
Have a look at the Fibonacci levels marked in the blog for more targets.
If you’re interested in the live trading room, it is now primarily stock market futures content, though we do track heavily traded stocks and their likely daily trajectories as well – we begin at 9am with a morning report and likely chart movements along with trade setups for the day.
As long as traders remain aware of support and resistance levels, risk can be very adequately managed to play in either direction as bottom picking remains a behavior pattern that is developing with value buyers and speculative traders.
Thanks for reading.
Twitter: @AnneMarieTrades
The author trades stock market futures every day and may have a position in mentioned securities at the time of publication. Any opinions expressed herein are solely those of the author, and do not in any way represent the views or opinions of any other person or entity.


