Even as U.S. stocks are coming under renewed pressure, there is a battle brewing between newsletter writers and mom-and-pop investors. They are on different wavelengths as far as market sentiment goes, feeding the bears and bulls, respectively.
First let’s discuss the Investors Intelligence poll. II bulls printed 42.2 this week (bears were 17.5), and have been sub-50 the past six weeks. But this follows an extended period of above-50 readings. Bears dipped below 14 three times in April and May.
Now let’s look at the American Association of Individual Investors (AAII). In contrast, the last time the AAII bulls count was north of 50 was early January. This week, bulls were 24.3, and bears 31.7.
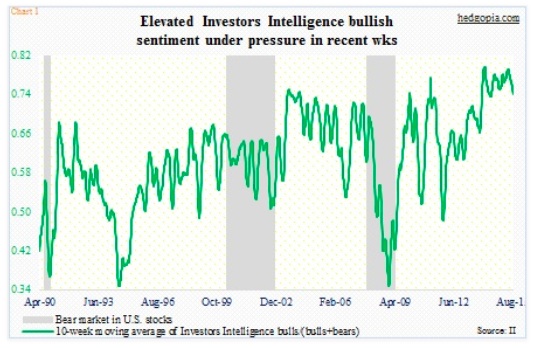
The divergence between the two groups is vividly seen in Charts 1 and 2 (above & below). In both charts, the bulls are divided by bulls plus bears, and the result is used to calculate a 10-week moving average. This smooths out the gauge of market sentiment.
The charts say it all.
In Chart 1, the green line in the current bull market has exceeded the prior two peaks. In 2007, it began to drop from a low-70s reading. Prior to that, in 1999/2000, it dropped from high 60s. This shows how extended this market sentiment metric has been in the current cycle, particularly the last couple of years. Most recently, it peaked at .793 toward the end of April, and has been under pressure since, with the most recent reading of 0.743. Is this the beginning of something big – a big drop that is? Well, perhaps not if we look at Chart 2.
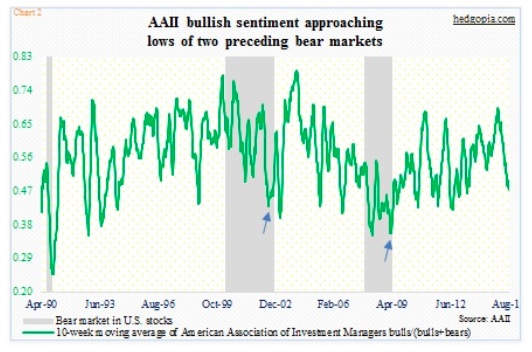
First of all, prior to the 2000 peak in stocks, the green line in Chart 2 began to drop from high 70s. Come 2007 peak (in stocks), however, the 10-week average, already under pressure since February 2004, was in high 50s right before the bear market began. This time around, it has been dropping since it peaked in January at .7. There is no pattern or symmetry in Chart 2 as is seen in Chart 1. Not sure Chart 2 can be taken as a signal.
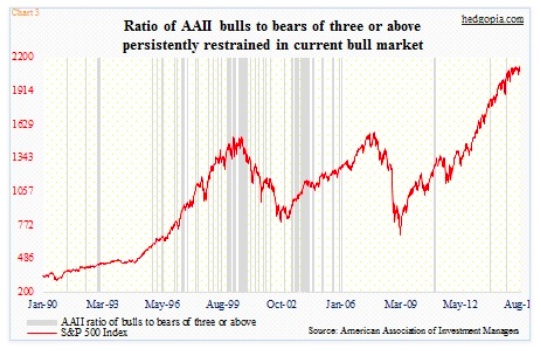
The same message is conveyed by Chart 3. The grey columns represent the weeks in which AAII bulls were three times as many as bears. Since the current bull market began six-plus years ago, barring a few instances, it has been a rare occurrence! As a matter of fact in Chart 2 the current reading of 0.47 is closer to the readings of mid-30s to low-40s recorded toward the end of the last two bear markets (arrows). Unless retail investors were saying one thing and doing the other, they have been cautious all along. Maybe this is one wall of worry stocks have been climbing all these years anyway.
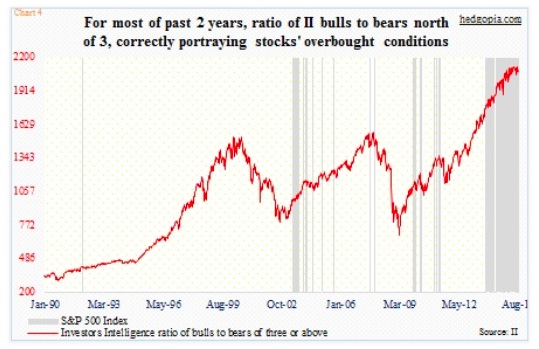
Switch to Chart 4, and the message does a 360-degree turn. It is the same as Chart 3, except the grey bars represent the Investors Intelligence survey. For the majority of nearly two years now, the ratio of bulls to bears have been at three or above – correctly portraying the overbought conditions stocks have been in.
The last time the S&P 500 Index had a 10-percent correction was in April-June of 2012. It came very close in September-October last year, but missed by a whisker. These overbought conditions are represented well by Chart 4, not Chart 3.
Once again, it is too soon to say if the recent April high of .793 in Chart 1 and the subsequent drop is the beginning of something serious, but the fact remains that the elevated levels of market sentiment in Charts 1 and 4 have a ways to go before they are unwound. This is the wavelength worth listening to.
Thanks for reading and have a great weekend.
Twitter: @hedgopia
Read more from Paban on his blog.
No position in any of the mentioned securities at the time of publication. Any opinions expressed herein are solely those of the author, and do not in any way represent the views or opinions of any other person or entity.

: Showing Some Signs of Emerging Strength")
