Sell in May has come and gone, and the S&P 500 (SPX) continues to trend along the top of its primary bull market channel.
Interestingly, the long-term bond market has proved bullish as well, breaking above its 10/50 week moving average in late March.
Those who follow the intermarket relationships of equities vs. the long-term bond market in recent years would have expected the SPX to weaken when the TLT gained strength. Instead, the market continues up the channel, and arguments about the various divergent markets and signals have devolved into a repetitive chorus.
Check out the chart below, highlighting the primary (red) and intermediate (green) bull market channels since 2010.
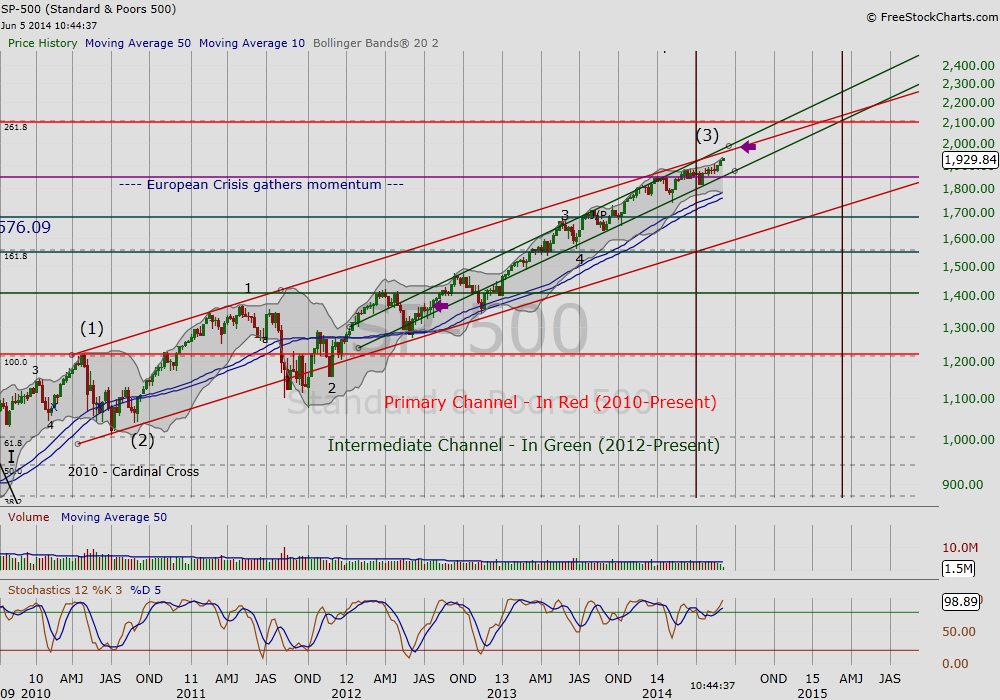 Figure 1 Weekly Chart of SPX 2010 – Present
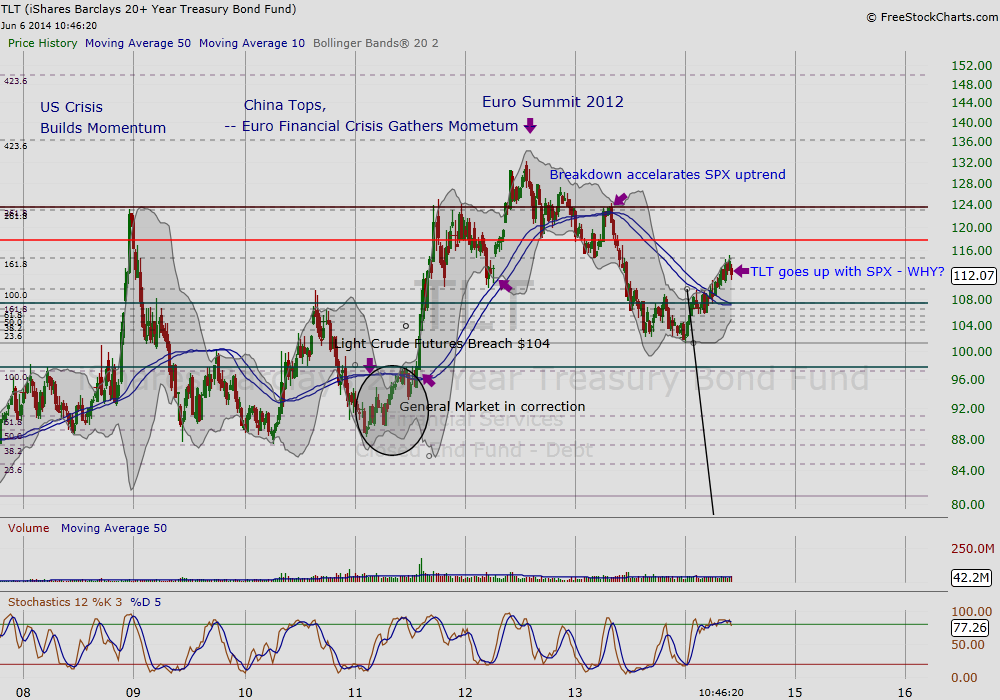 Figure 2 Weekly Chart of TLT (20+ year Treasury) 2008 – Present
Making Sense of Divergent Markets
The equities market, while bullish, has favored a defensive play since Fall 2013. Likewise, long-term government bonds, e.g. TLT, which are considered relatively risk-free, bottomed around the same time. Looking at it from this perspective, there is less divergence and more confirmation that we should be cautious at this stage of the uptrend.
Here are a few additional insights about the current state of our divergent markets:
Understanding Small Businesses – Recently, I asked my husband his take on the small businessman. He and my father-in-law are active members in their respective Rotary and BNI. What better way to understand what is happening on the ground of our economy than to observe the people who are most directly tied to its rise and fall? In summer of 2012, regardless of the storm brewing in Europe, the small businesspeople in my community had a sense of cautious optimism. However, a year later, despite signs of an improving economy and resiliency from the small business community, wages have remained stagnant (see Anemic Wage Growth 2013). Anemic wage growth still warns us that the growth of the economy on the ground has not kept pace with growth in the equities market. This means that while small businesses are keeping their lights on and feeling less pressure, they are still waiting for things to get better.
QE and Chasing Alpha – This brings us back to the Fed’s liquidity policy, adopted as a counter cyclical measure, to avert another 1930’s Great Depression. As the charts of the TLT and SPX above confirm, when the TLT peaked in the summer of 2012, then later fell below its 10/50 week moving average, signaling a return of rising interest rates and economic growth, the SPX moved up as we would have expected. The SPX in 2013 reflected a sense of euphoria, and many lauded the beginnings of the next secular bull. However, what was missing from the rising trend was volume. Moreover, in the fall of last year, the market began favoring defensive stocks and the TLT found a base. In March of this year, the TLT broke out from its base and above its 10/50 week moving average. This time, the SPX continued to rise, but again, the leaders came from sectors less susceptible to earnings volatility.
The Liquidity Pool and Rising SPX – This takes us back to the small businessman and middle class worker, who, judging by market volume, did not participate in much of the 2013 uptrend. So, what explains the today’s continued upward momentum for the SPX? With the equity markets at new highs and improving job stability, we can creatively surmise that 401K contributions for workers increased last fall, when those elections were made. Ironically, during the same period, the market shifted to a defensive stance. The long-term bond market, moving in sync with the equities market since late March, confirms this defensive move.
The Take Away
What we’ve learned in the past is that when existing relationships change, it is a sign that market conditions have changed. In this case, the changing relationship of long-term bonds and the equities market might be traced to rising liquidity pools. Unfortunately, the market’s preference for defensive stocks and long-term bonds is confirmation that it is cautious, which increases the danger of a sharp retracement. However, this is not 2007 all over again, as some claim. The emotions in the economy then and today tell very different stories. Though there has been a sense of euphoria in the equities market, this has not reached the small businessman and the middle class. This market has simply gotten ahead of itself, but the risk of a rising liquidity pool, putting pressure on money managers to seek alpha in fewer and fewer opportunities, might be something to keep in mind while following this rising tide.
Resources and Recommended Reading:
- Easterling, Ed (2005). Unexpected Returns: Understanding Secular Stock Market Cycles. Cypress House: CA.
- Graham and Dodd (2009). Security Analysis 6th Edition. McGraw Hill: New York
- Stiglitz, Joseph E. and Members of the UN Commission of Financial Experts (2010). The Stiglitz Report. The New Press: New York and London
- Stock Charts from FreeStockCharts.com
No position in any of the mentioned securities at the time of publication. Any opinions expressed herein are solely those of the author, and do not in any way represent the views or opinions of any other person or entity.


