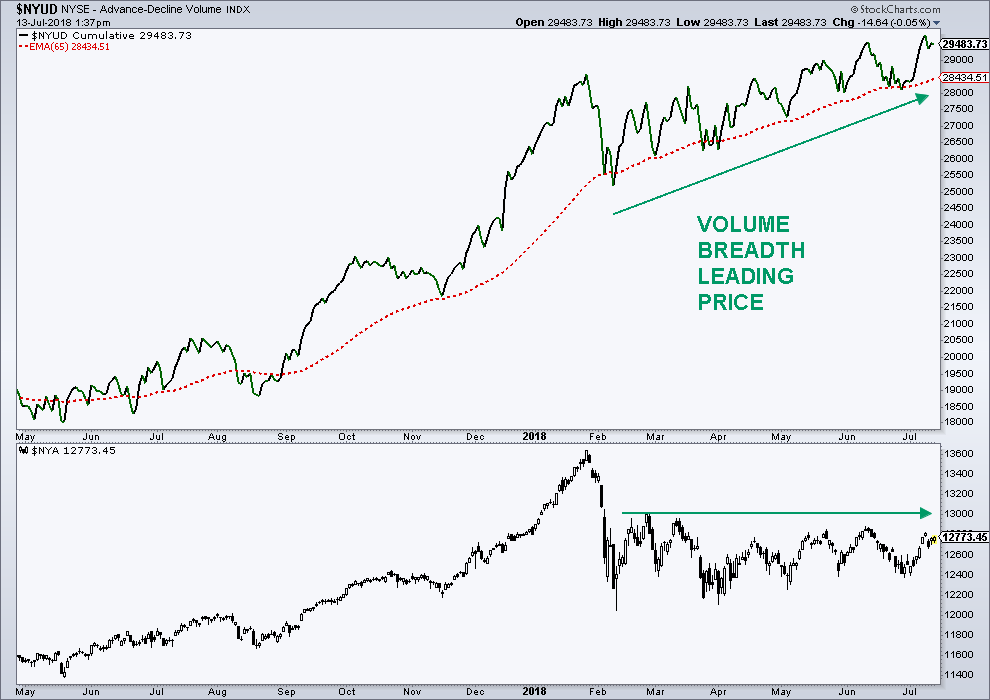
The NYSE AD volume line (cumulative advancing volume – declining volume) peaked in mid-1999, eight or so months prior to the price peak.
Today, we just hit another bull market high this month despite the NYSE Composite not making a new high yet. There is just a massive difference under the surface between the two periods with today’s breadth continuing to signal a resolution to new highs.
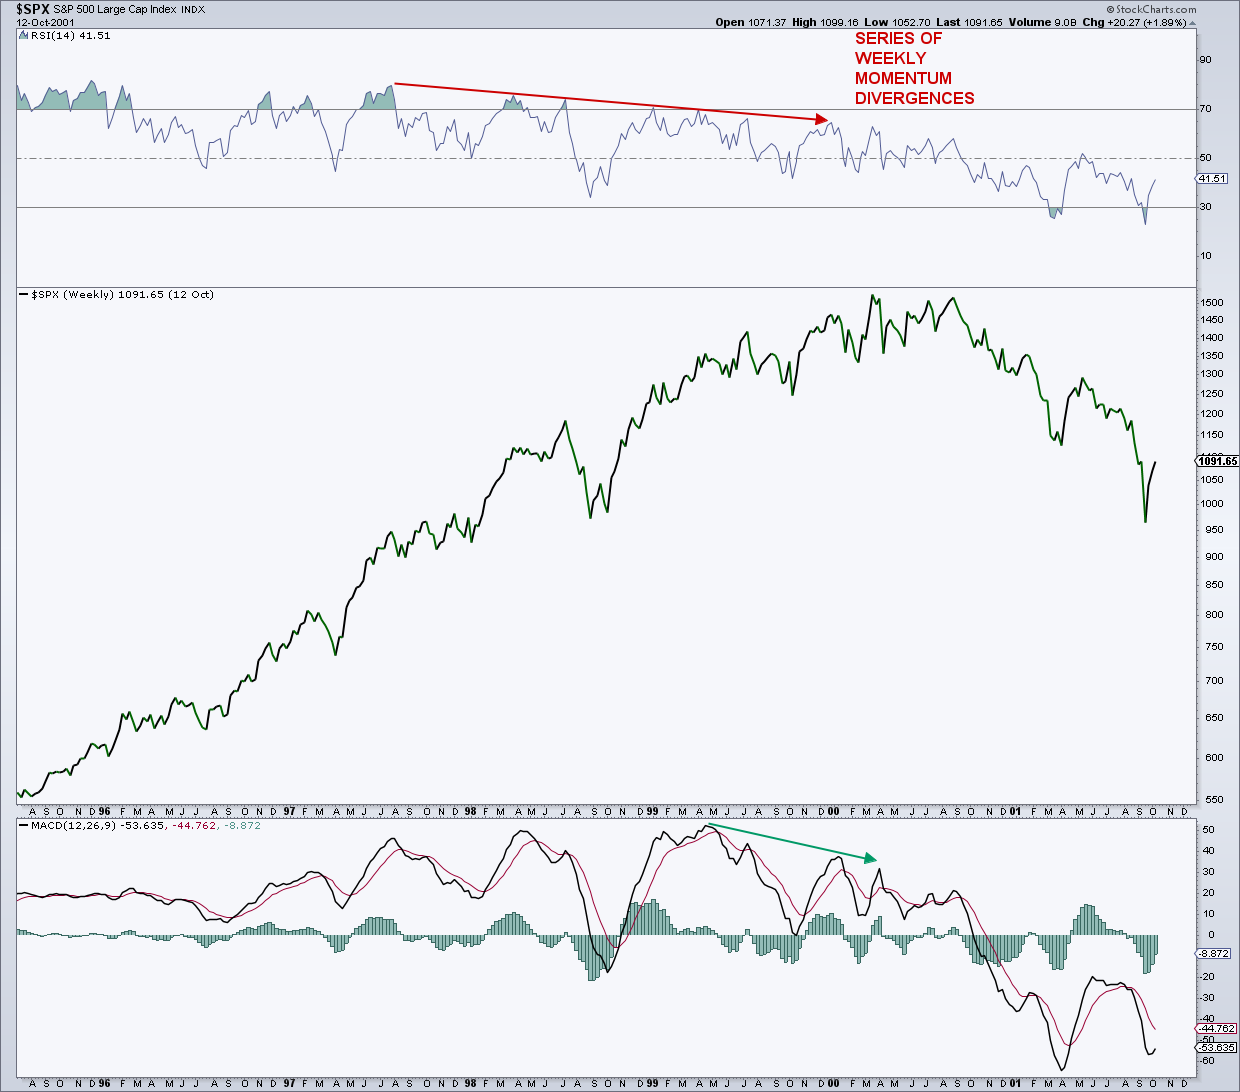
The third major difference is the action of the weekly and monthly momentum, using the 14-period RSI as well as the MACD. The 14-week RSI actually peaked in 1995, but did hit an extreme overbought condition of about 80 in 1997 and about 76 in 1998. The real divergences in the 14-week RSI started to present themselves in early 1999. So, there were a handful of momentum divergences along the way. The weekly MACD peaked in April 1999 and then traced out a couple of bearish divergences going into the March 2000 peak.
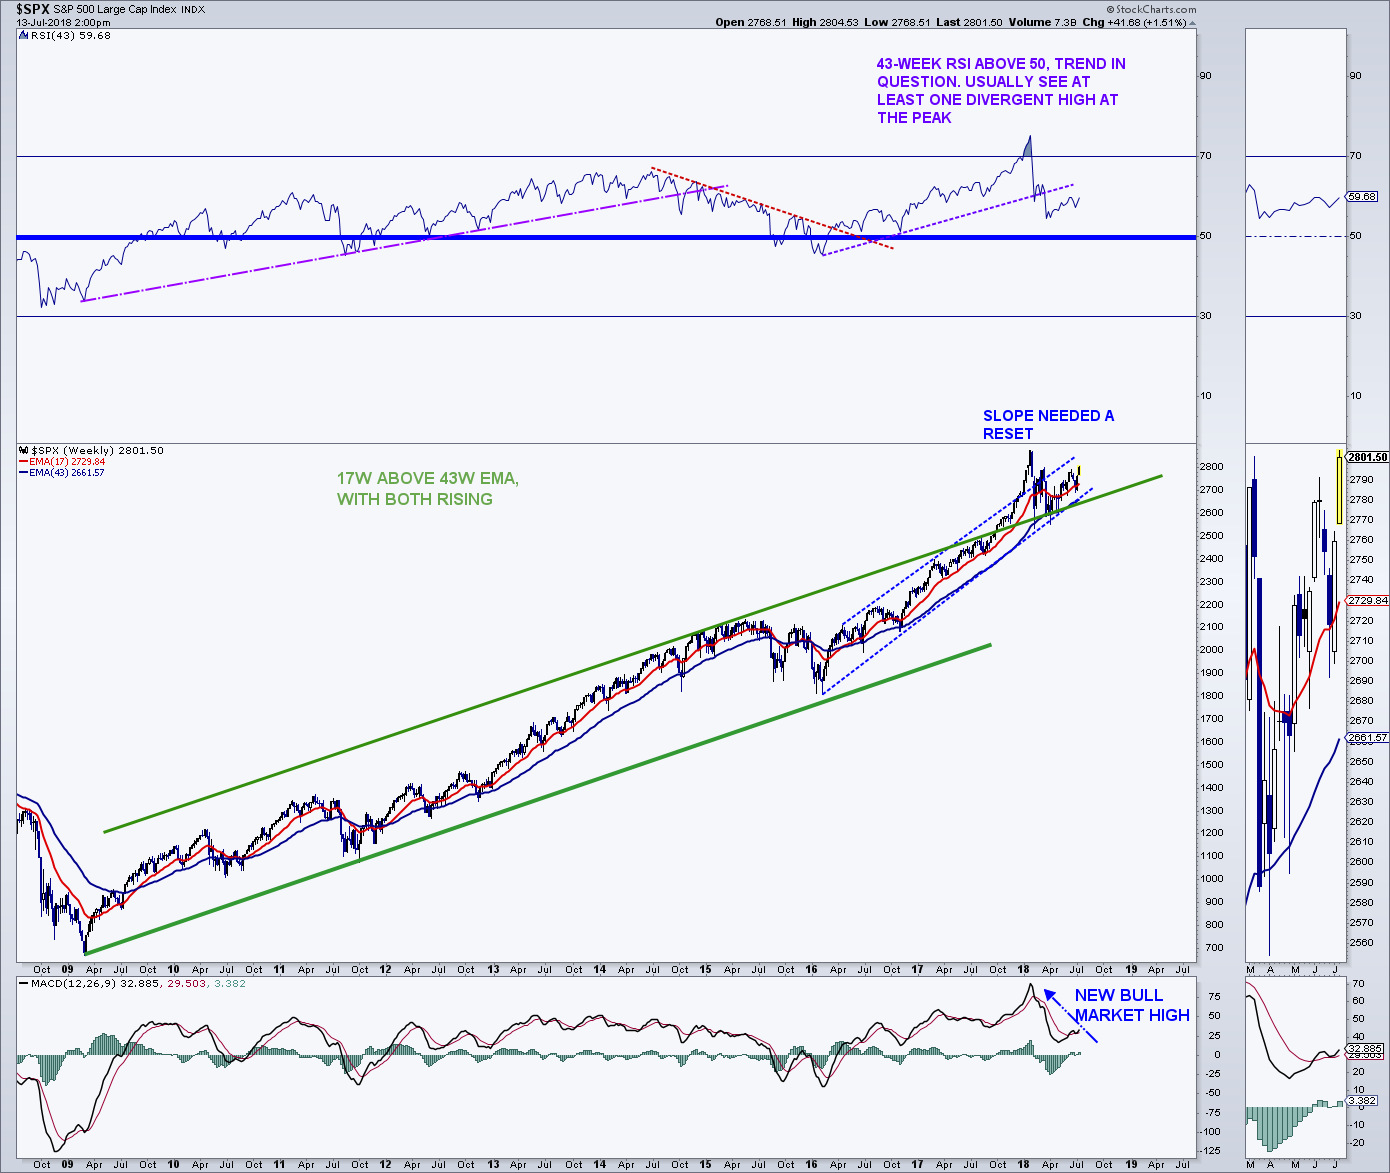
Today, the bull market peak (so far) in weekly momentum occurred in January. For another typical momentum divergence to occur, price must move to a new high. Just looking at the weekly momentum indicators, it is very possible that the next price high on the “500” will create a pretty good weekly momentum divergence. Many times, there is more than one divergent high.
Looking at the 43-week RSI, we see years of divergent highs before the price peak. We also see numerous spikes below the 50 level, which also can be considered warnings.
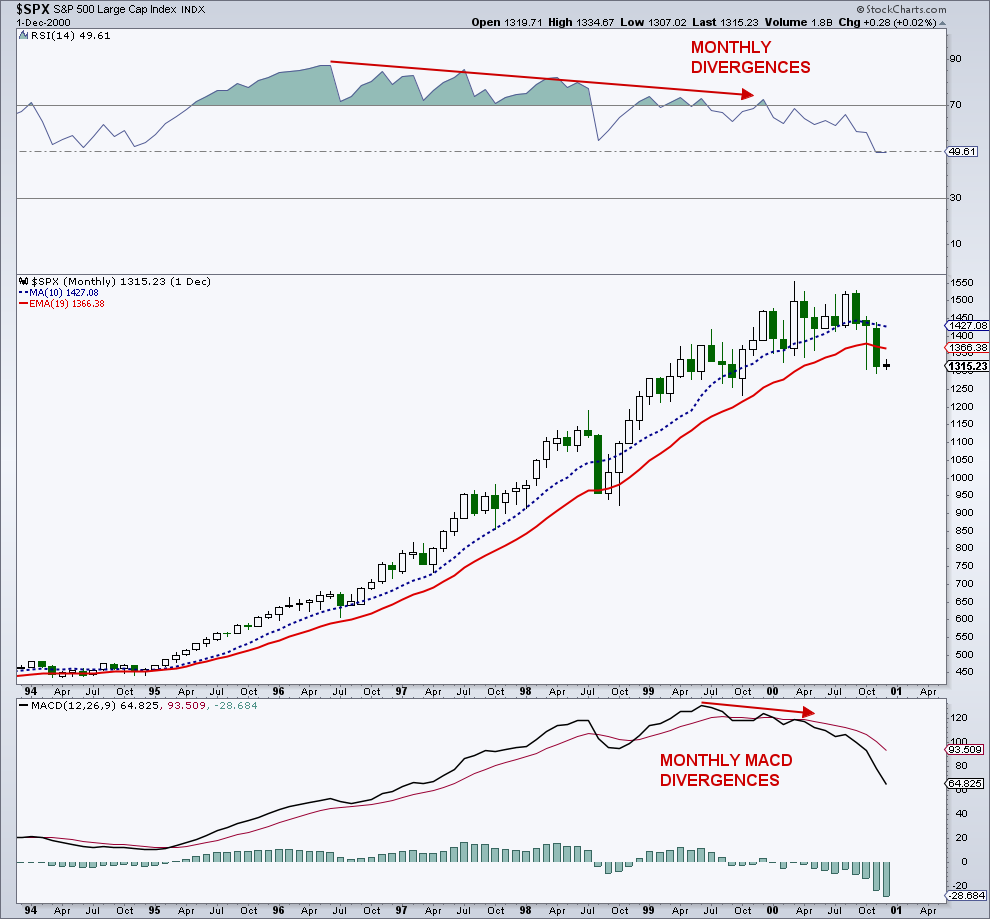
On a monthly basis, there were years of bearish divergences when looking at the 14-month RSI. The monthly MACD peaked in mid-1999, well before the price high. Today, the peak (so far) in monthly momentum occurred in January with the latest run to all time highs divergence free. It’s possible that the monthly MACD goes to another high if price does the same, but it looks like the next price high will create a divergence with respect to the 14-month RSI.
Feel free to reach out to me at arbetermark@gmail.com for inquiries about my newsletter “On The Mark”. Thanks for reading.
Twitter: @MarkArbeter
The author may have a position in mentioned securities at the time of publication. Any opinions expressed herein are solely those of the author, and do not in any way represent the views or opinions of any other person or entity.

: Showing Some Signs of Emerging Strength")
