Key Takeaway: Inflation expectations have been muted, but core inflation measures have started to move higher. This could put some upward pressure on bond yields, but also helps validate the decision by the Fed to raise rates in December.
The Federal Reserve has a dual mandate: fostering maximum employment and price stability (generally interpreted as low and stable inflation, not actually stable prices).
The steady declines in the unemployment rate have suggested it was making progress on the employment mandate, but over the course of the recovery inflation has generally fallen short of the Fed’s target. In fact, the lack of perceived inflation pressure has led many to conclude that the Fed should not have begun to normalize interest rates by raising the fed funds rate in December. The latest data, however, provides some evidence that inflation is starting pick up, and perhaps inflation expectations will follow later on this year.
The headline CPI data continues to be weighed down by declines in energy prices (down 2.8% last month), but the core CPI (which excludes food and energy prices) surged in January, posting the largest monthly gain in years.
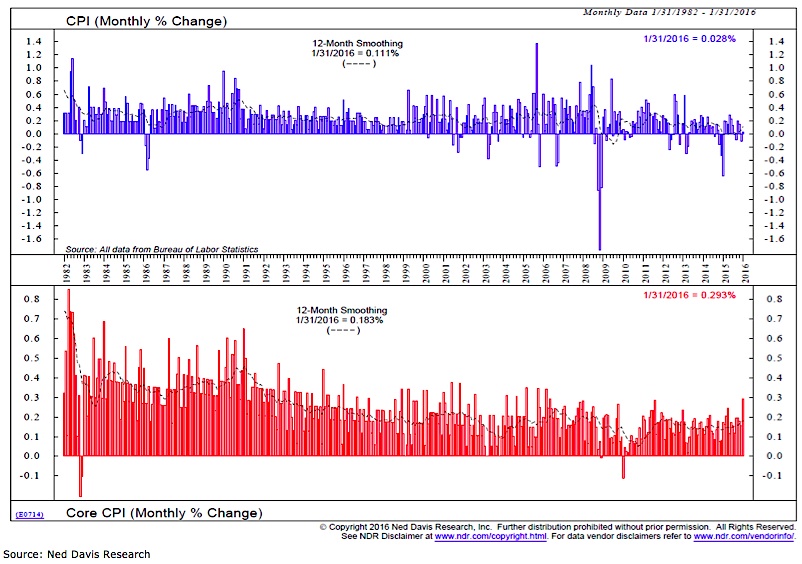
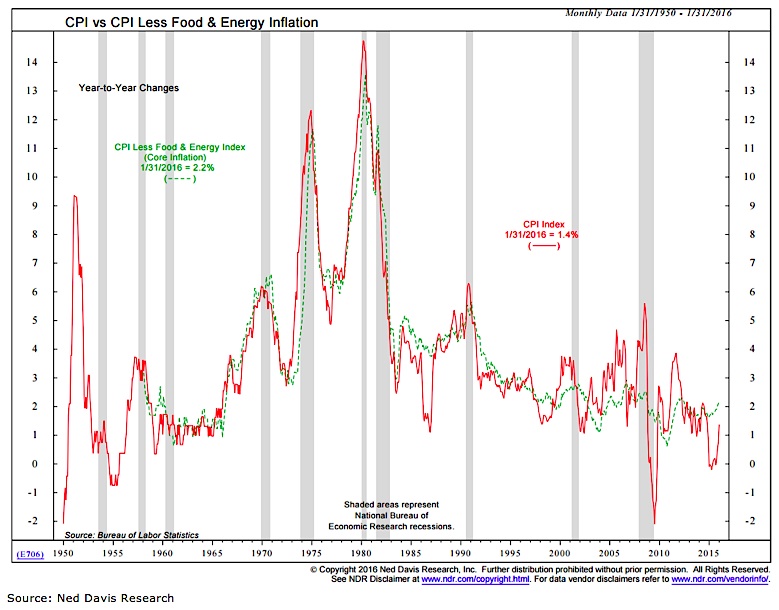
While the January increase has garnered attention, inflation is not really a month-to-month phenomenon. The year-over-year changes in both the headline CPI and core CPI have started to move higher in recent months as well, with the yearly change in the core CPI moving above 2%.
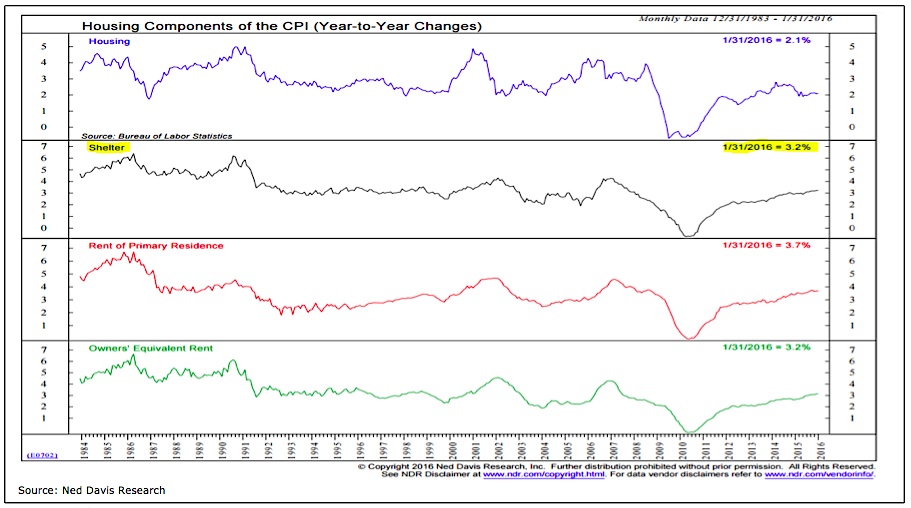
A big driver behind the rise in the core CPI has been the recovery in the housing market. Data released today showed this strength has continued. Existing home sales were unexpectedly strong and the median sales price has risen over 8% over the past year. The shelter component (which accounts for one-third of the overall CPI and 40% of the core CPI) has risen 3.2% over the past year.
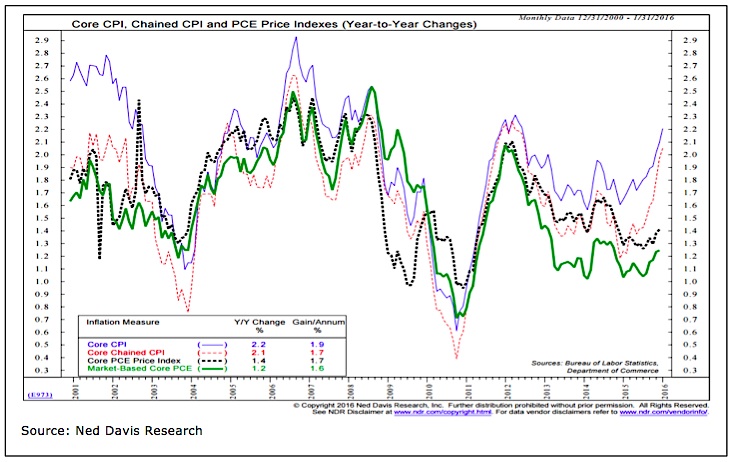
While the Fed keeps tabs on a number of inflation measures, the one for which it actually provides guidance is the core PCE price index. The yearly changes in the PCE measures of inflation have been more muted than what has been seen in the CPI, but a similar pattern has emerged. Yearly changes in inflation appear to have bottomed and are now starting to move higher.
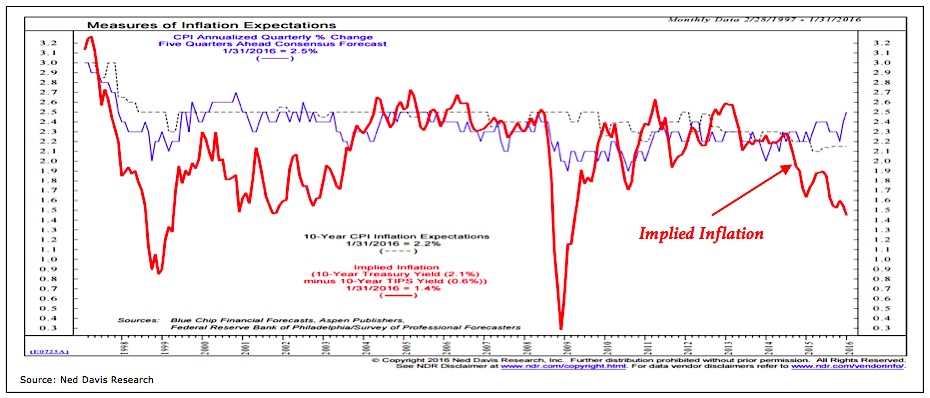
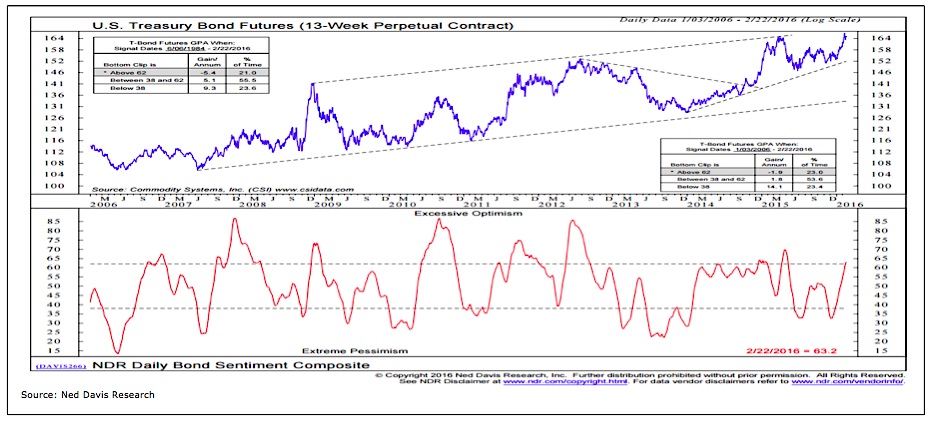
Now, the uptick in inflation that has been seen does not suggest that rampant and runaway inflation is on the horizon. But it does come following a period when market-based measures of implied inflation expectations have dropped sharply. In other words, it might not take much of an increase in inflation to lead to a resetting of expectations. This could put some upward pressure on bond yields at a time when optimism in the bond market is moving into the excessive zone.
Thanks for reading.
Further reading from Willie: “Stock Market Update: The Prospects For More Gains“
Twitter: @WillieDelwiche
Any opinions expressed herein are solely those of the author, and do not in any way represent the views or opinions of any other person or entity.

: Worrisome to Broader Market?")

