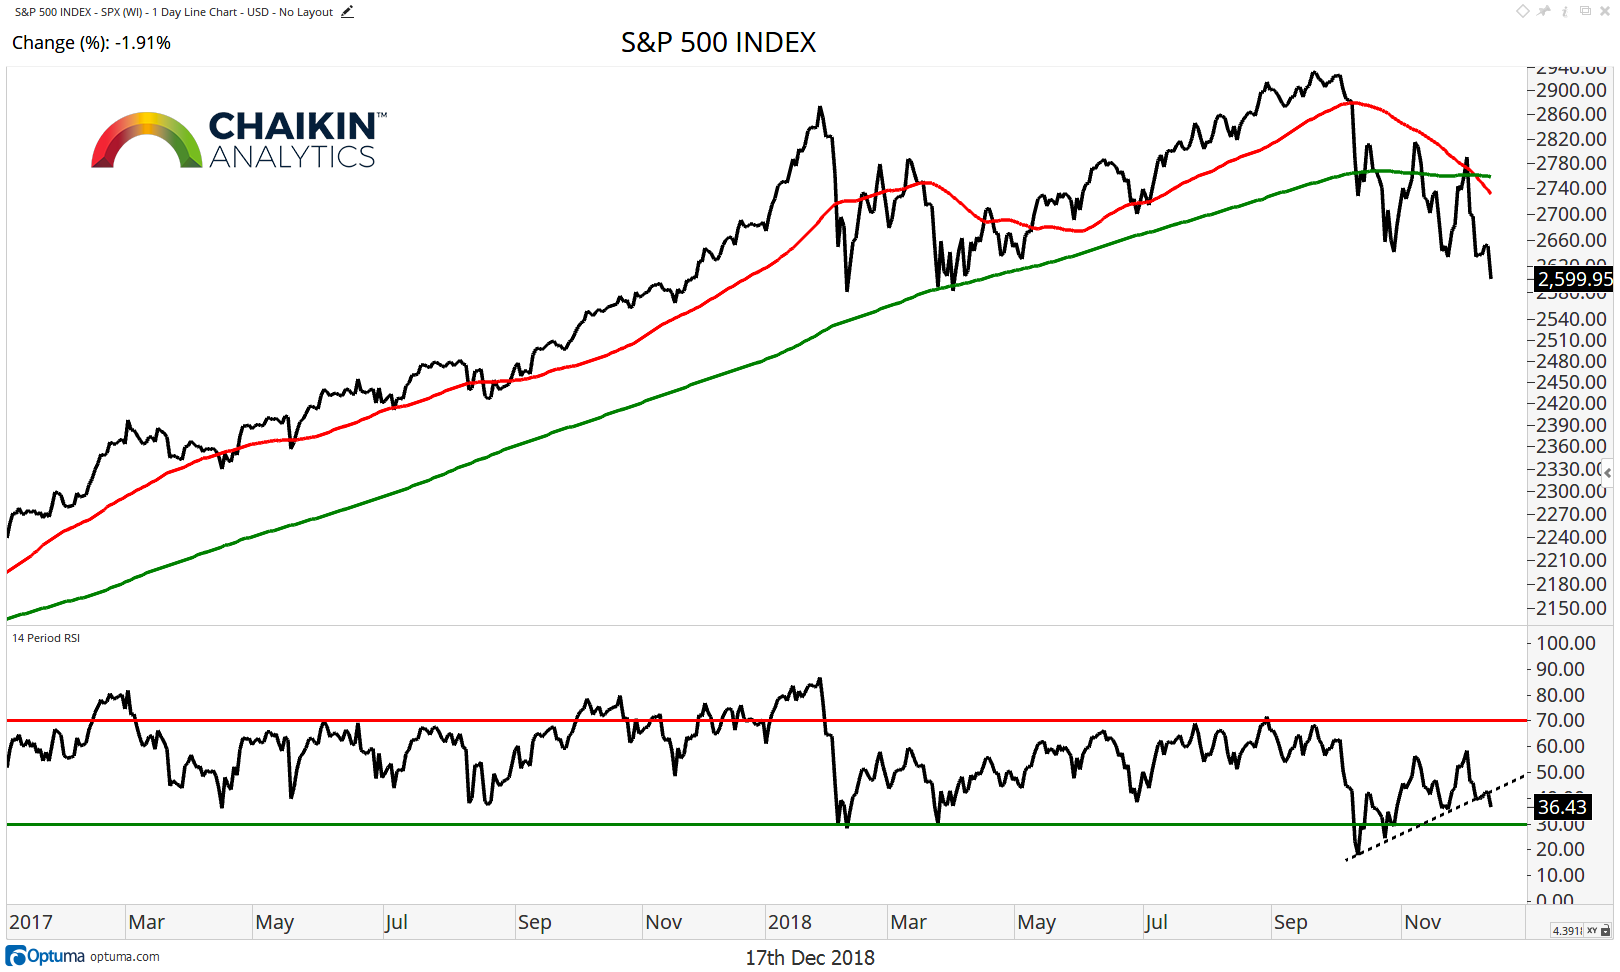
On a closing basis, the S&P 500 (NYSEARCA: SPY) has moved below the October and November lows as it toward the January lows.
The index remains below the declining 50 and 200-day moving averages to signal that the trend is down.
The RSI remains in bearish ranges confirming the price weakness and has broken its uptrend line after making a series of higher lows. (note these charts are through Friday, December 14)
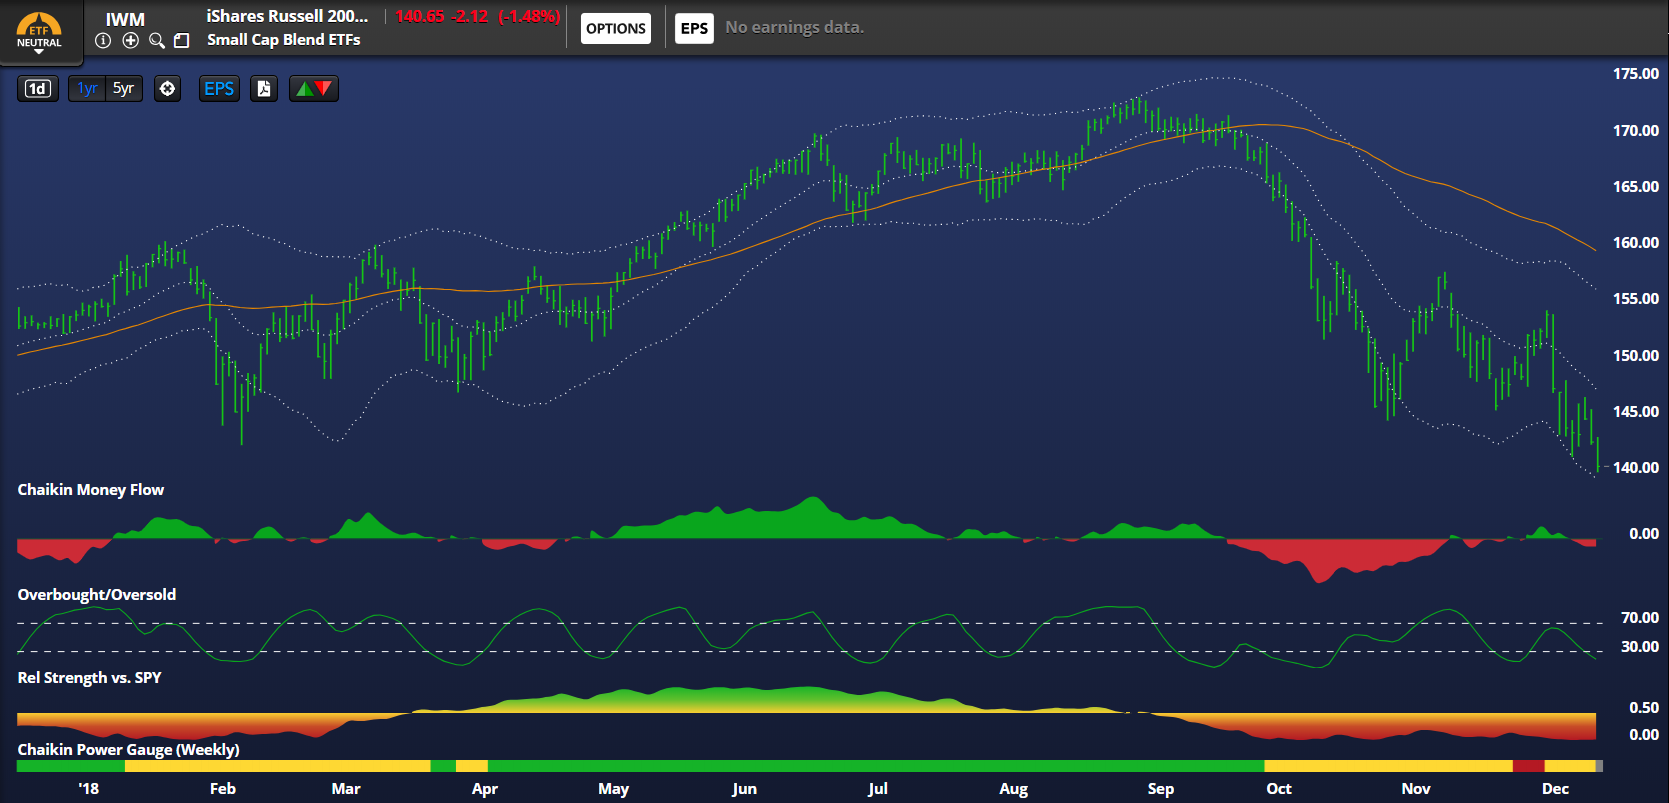
Small Caps
The iShares Russell 2000 ETF (NYSEARCA: IWM) continues to underperform the SPY and the intensity of underperformance increased again last week. The fund has a Neutral Chaikin Power Gauge ETF Rating and has broken below the lows from late January.
Our Overbought / Oversold Indicator has reached an oversold reading, but Chaikin Money Flow has turned bearish as investors continue to de-risk portfolios by selling the smaller cap names.
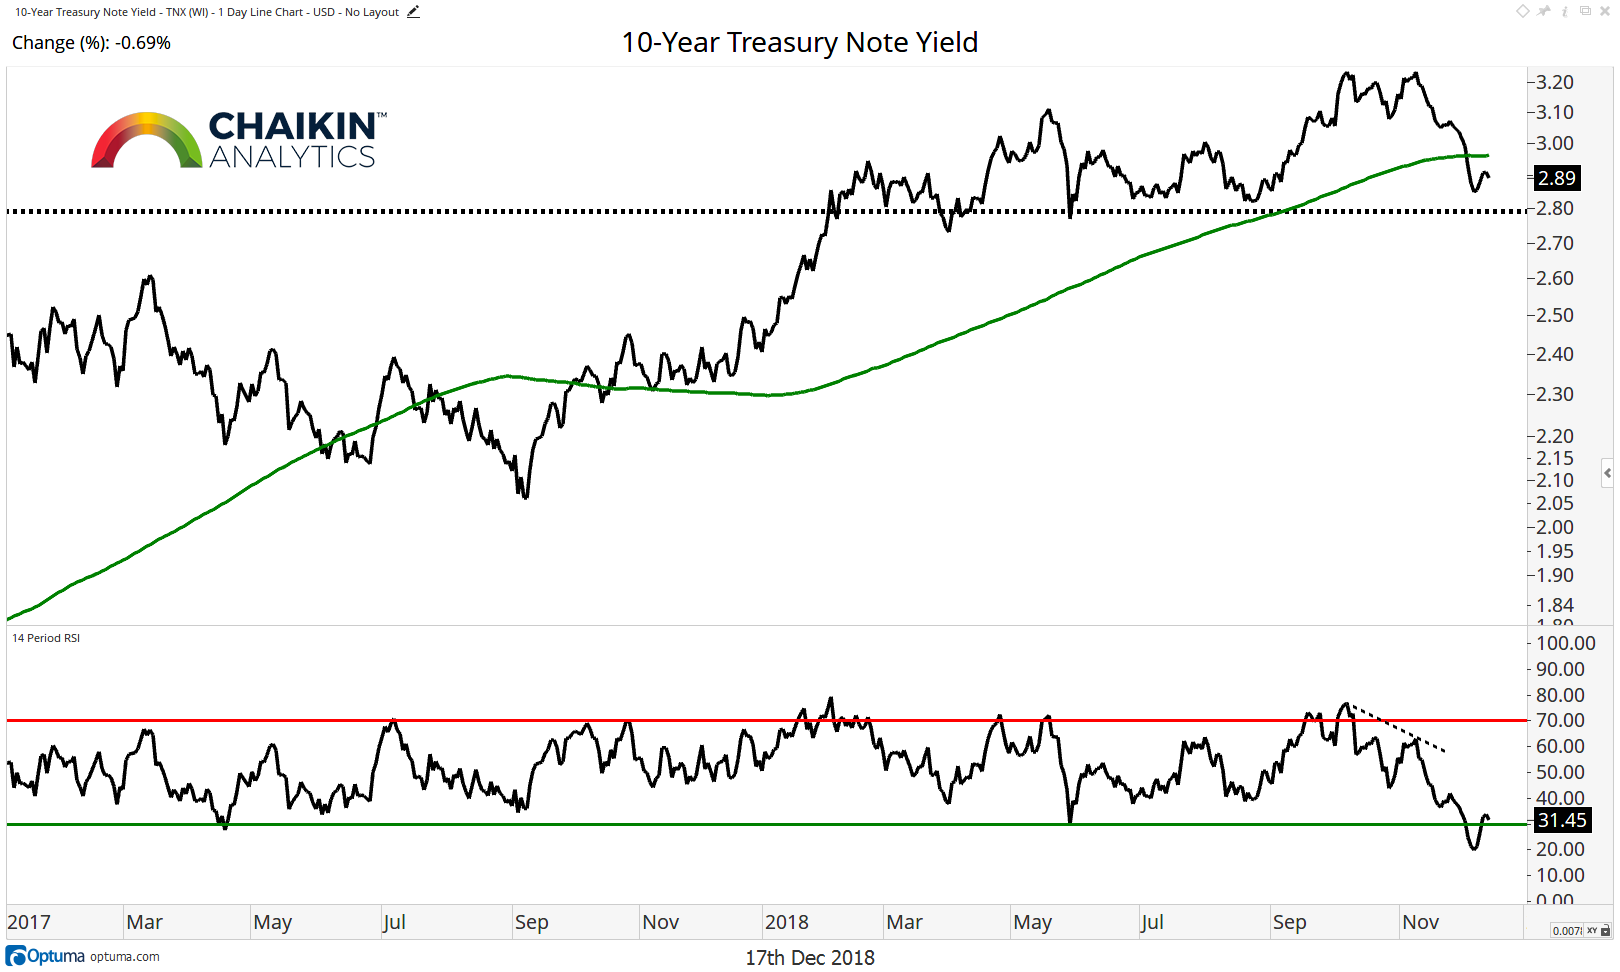
Fixed Income
The 10-Year Treasury Yield (INDEXCBOE: TNX) closed at 2.89% last week to remain below the 200-day moving average which is beginning to shift from rising to flat. After making a large negative divergence at the recent peak in yields, the RSI has move back into bearish ranges. Further declines in the 10-year yield will likely have a positive impact on the bond proxies in the equity market such as Real Estate and Utilities.
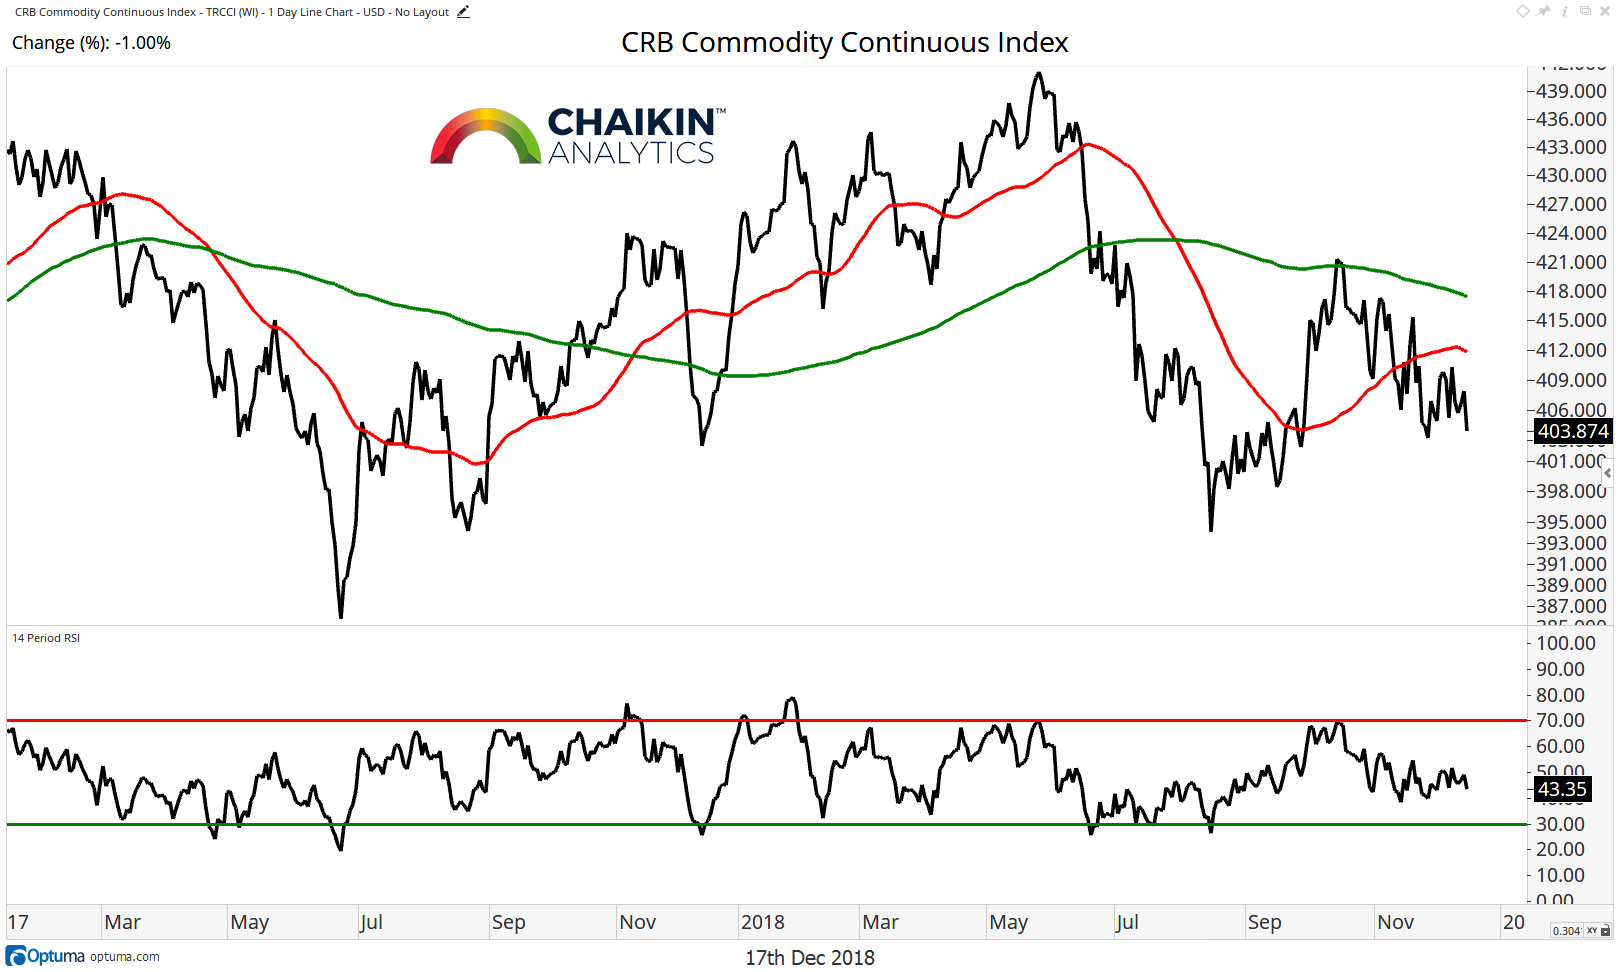
Commodities
The CRB Commodity Index remains below the 50 and 200-day moving average, both of which are declining, as the fall in the price of oil has had a negative impact on the commodity complex. The RSI is in neutral ranges and has not become oversold as the price of commodities has declined since September. Further weakness in the price of commodities will likely keep the Materials sector under pressure. As Marc pointed out in his note yesterday, there are currently zero stocks in the Materials sector with Very Bullish / Bullish Power Gauge Ratings.
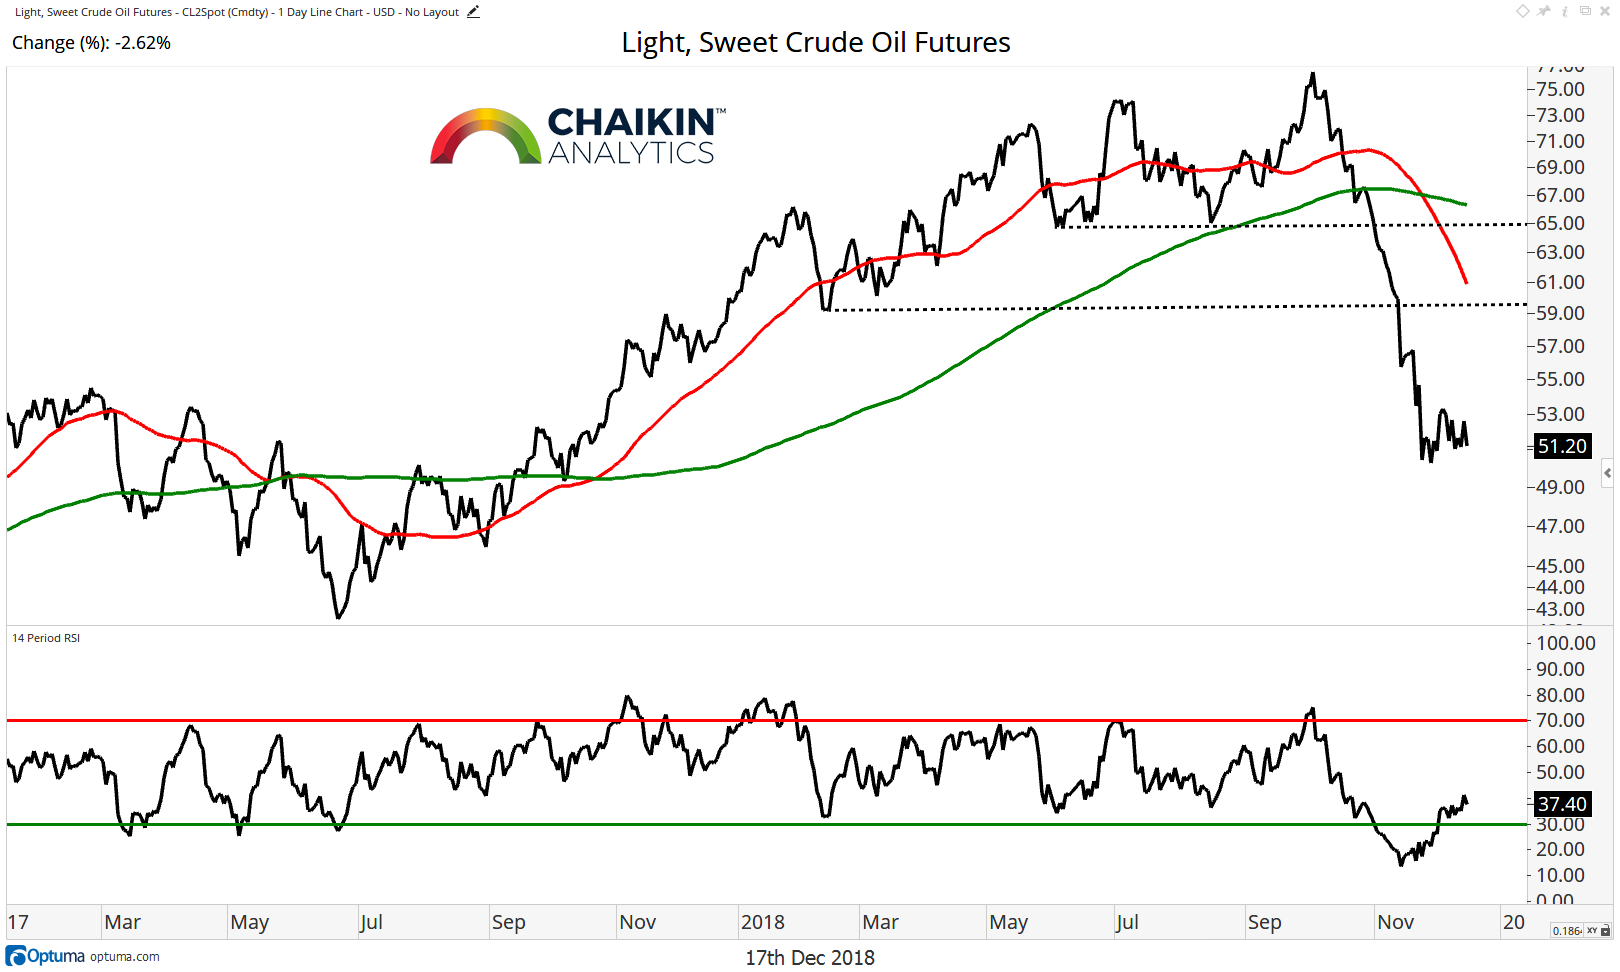
Crude Oil continues to move out of the oversold position which we called out last week as it has thus far held support near $50. Crude remains below the 50 and 200-day moving averages, both of which are declining. A rally from here is likely to meet resistance near $60 then again near $64.
The Dollar
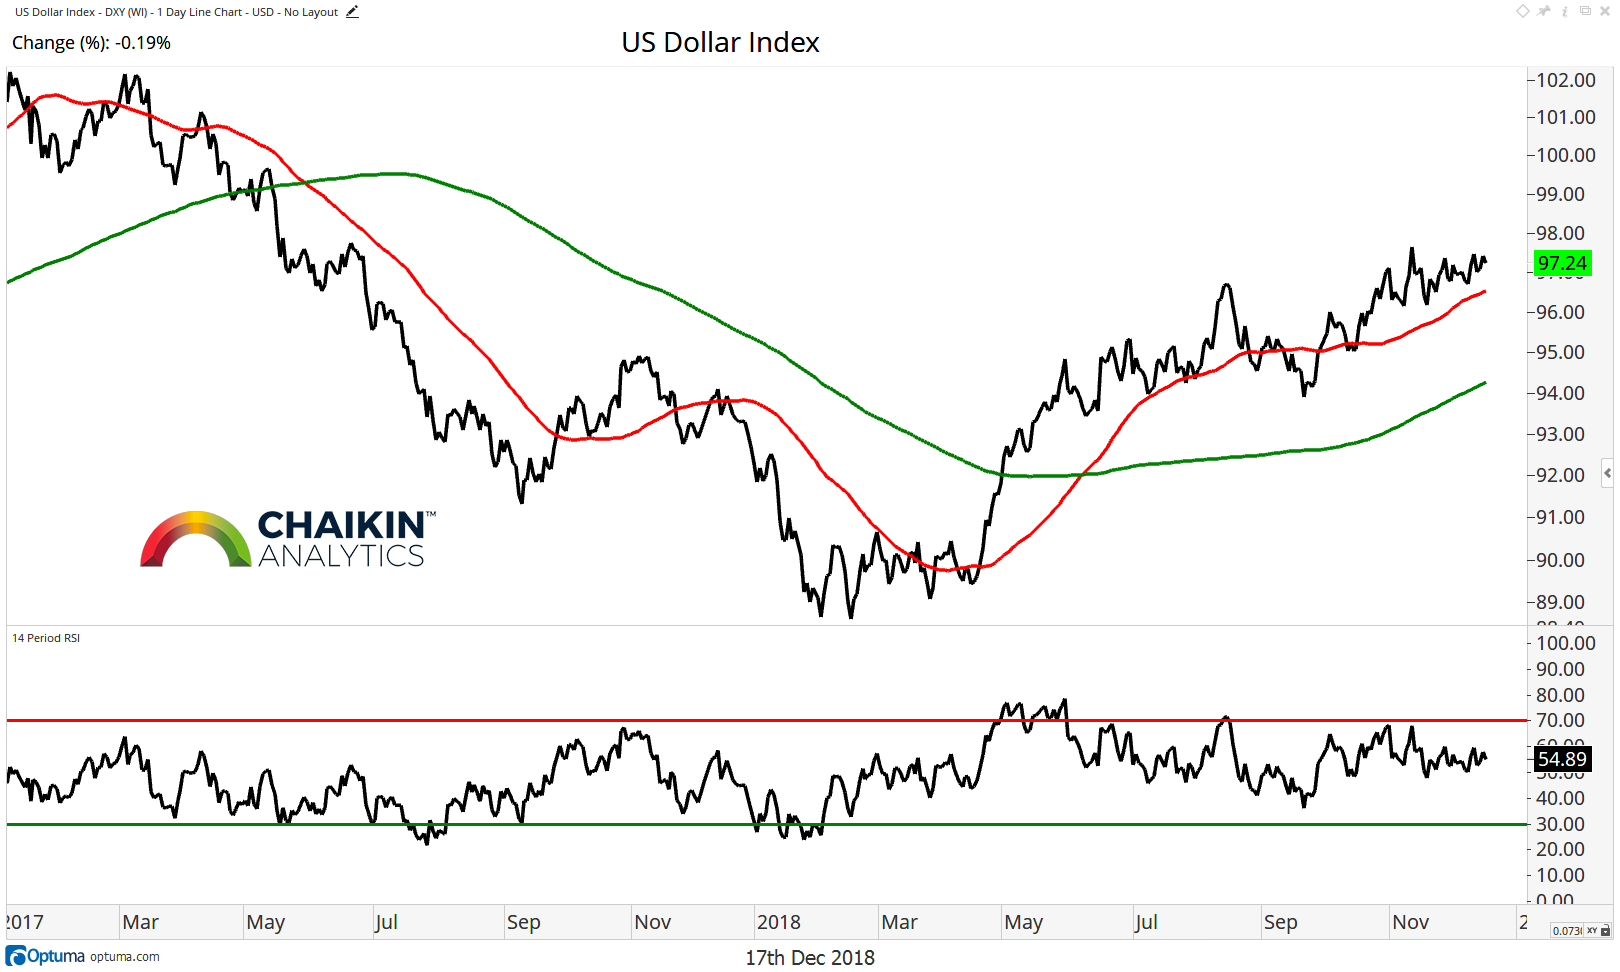
The Dollar Index remains above the rising 50 and 200-day moving averages as it consolidates within the uptrend which began in March. The RSI is in bullish ranges confirming the price trend. Odds favor a resolution to the upside for the index.
Twitter: @DanRusso_CMT
Author may have a position in mentioned securities at the time of publication. Any opinions expressed herein are solely those of the author, and do not in any way represent the views or opinions of any other person or entity.

: Showing Some Signs of Emerging Strength")
