Lumber Futures Prices versus S&P 500 Index Performance Chart
One unsung market indicator is the price of lumber. It is a key indicator of the economy (home building, business expansion) and that often finds its way to the stock market.
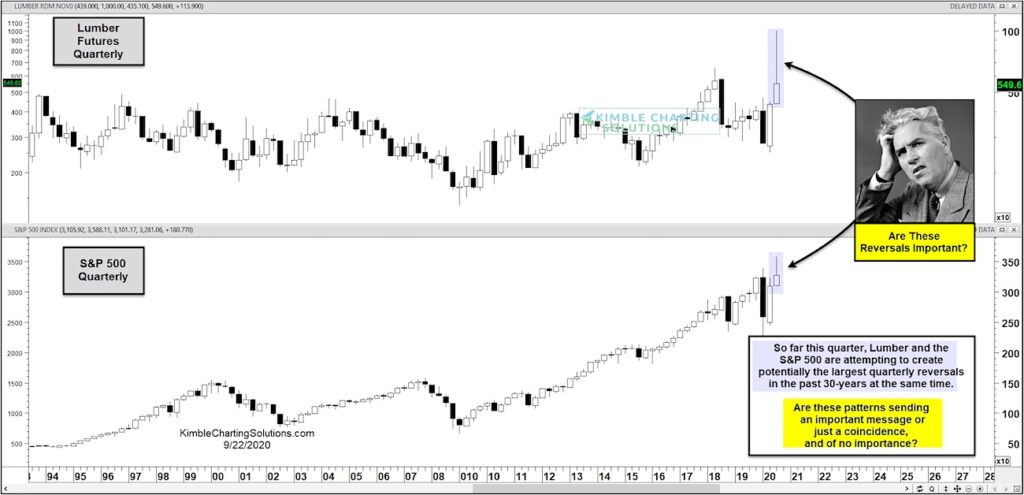
In today’s chart 2-pack we look at long-term “quarterly” charts of lumber prices and the stock market… and why both are signaling caution thus far this month.
As you can see, both lumber prices and the S&P 500 are in the midst of creating there largest quarterly reversal patterns in 30 years!
Time will tell if these two markets are sending an important warning to investors (and the economy)… or perhaps they are just noise. Stay tuned!
Note that KimbleCharting is offering a 2 week Free trial to See It Market readers. Just send me an email to services@kimblechartingsolutions.com for details to get set up.
Twitter: @KimbleCharting
Any opinions expressed herein are solely those of the author, and do not in any way represent the views or opinions of any other person or entity.
: Creating Bullish Divergence?")

 and Semiconductors (SMH): Concerning Price Pattern?")
 and Semiconductors (SMH): Concerning Price Pattern?")


