One of the hallmarks of the current U.S. recovery has been very low wage growth (i.e. a lack of wage gains). Corporations have become the price setters, and employees the price takers.
It is not that U.S. corporates are not making money. Profits adjusted for inventory and capital consumption rose north of 112 percent from the 4Q08 low of $1.02 trillion to the 3Q14 peak of $2.16 trillion. Since that peak, profits have decelerated to $2.01 trillion in 3Q15, but remain healthy.
This, however, has yet to translate into healthy wage gains for employees. Big question is whether low wage growth will persist?
As a matter of fact, the wage-related correlation that existed in the past has ceased to work. Historically, the National Federation of Independent members’ compensation plans (NFIB) have shown a strong tendency to correlate with the U.S. unemployment rate.
But the relationship broke down, with the red line in Chart 1 (below) going sideways since the middle of 2014, highlighting the concern with low wage growth.
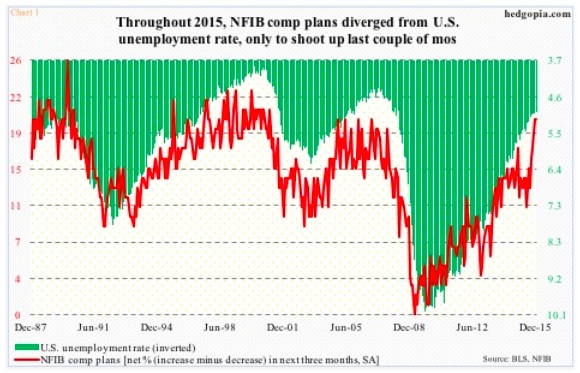
Most recently, NFIB comp plans bottomed in June last year at 11, rising gradually, and surging to 20 in November. December was flat month-over-month. The red line looks like it is attempting to catch up with the green bars all at one go.
NFIB members’ survey optimism is yet to show up in the numbers.
The average hourly earnings of U.S. private-sector employees has risen from $22.16 in June 2009 to $24.25 in December, down a penny from the November high of $25.25. Not too shabby, but wage growth has been lackluster.
Earnings grew 2.52 percent year-over-year in December. This was the fastest wage growth since 2.59 percent in July 2009. The last time earnings grew annually with a three handle was back in April 2009 (chart 2 below).
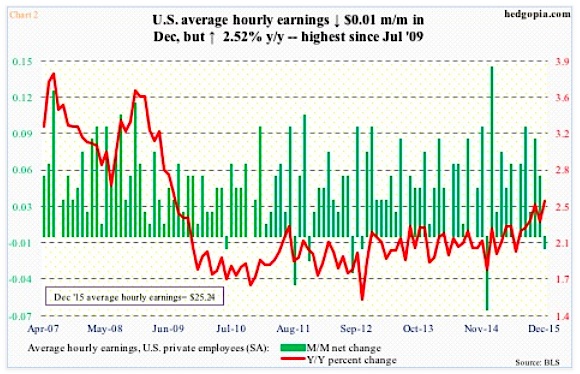
If there is any consolation in all this, it is that the trend in the red line is pointing up, particularly since December 2014.
The question is, would businesses be open to opening up their wallets? If so, that could help assuage concerns about low wage growth.
As far as multinationals are concerned, a strong U.S. dollar has been nothing but a pain.
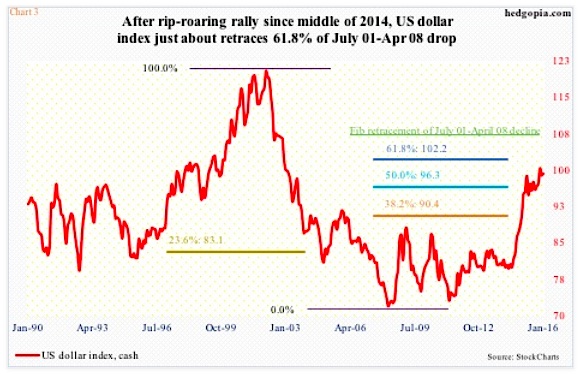
The US dollar index has been on a tear particularly since the middle of 2014. From June 2014 through March 2015, it rallied just north of 25 percent – huge move in the currency land. It has since gone sideways, with a retest of that March high in November.
Even though it has failed to break out, the dollar index has not wilted either. It is pausing at an interesting juncture, having retraced 61.8 percent of the July 2001-April 2008 decline (chart 3 above). This can be a good place for trend reversal.
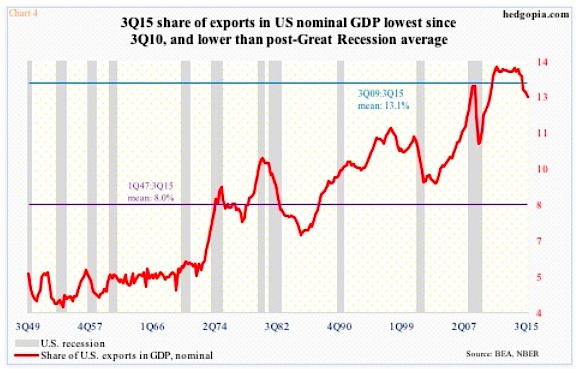
Regardless if it has peaked or will soon peak (or not), U.S. exports have already taken a hit.
Exports’ share in nominal GDP was 12.5 percent in 3Q15 – a five-year low. The red line in chart 4 below has been particularly trending lower since 4Q13, after having gone sideways since 3Q11.
In this context, stuck-in-the-mud wages likely is what corporations use not only to enhance profitability but also to gain competitiveness – almost like an internal devaluation. This is the rub with low wage growth.
Internal devaluation is when a country seeks to regain competitiveness not by devaluing its currency rather through lowering wage costs and increasing productivity.
Arguably, low wages have become a tool for corporate America.
Twitter: @hedgopia
Read more from Paban on his blog.
Any opinions expressed herein are solely those of the author, and do not in any way represent the views or opinions of any other person or entity.

 Trading Near Top Of Price Range")


