We hear a ton about equity markets and the volatility surrounding it. On occasions hearing how because market volatility is low that a stock market crash is on the horizon.
Here I want to really debunk that, and have you think about volatility differently.
The VIX Volatility Index (INDEXCBOE:VIX) is a key measure of very short term volatility measured through the gathering of near term option pricing. Therefore the Volatility Index (VIX) displays how investors feel today… like right now.
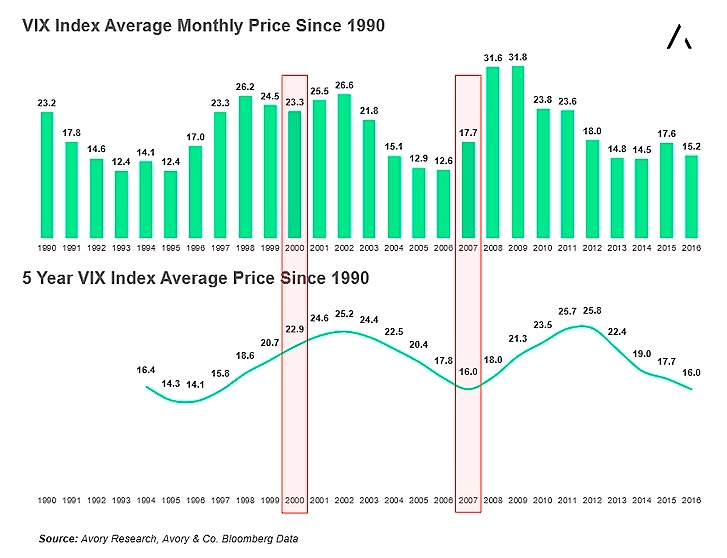
At Avory we went ahead and graphed the VIX index in two ways (see below). The top part is the end of year average price for the VIX Index, using month end values. The bottom looks at the 5 year average for volatility.
As you’ll notice, the VIX index behaved much different prior to the 2000 and 2007 crashes. This is because the FUNDAMENTAL root of each crash was much different. 2000 was excessive valuations with investors chasing free cash flow negative technology companies. 2007 was much more driven by a collapse in the banking sector.
I hope this clears the air somewhat. The VIX is a tool much better used for very short term sentiment readings, and should not be used to forecast longer term market views.
Thanks for reading and have a good one!
Read more form Sean on the Market Meter.
Twitter: @_SeanDavid
Any opinions expressed herein are solely those of the author, and do not in any way represent the views or opinions of any other person or entity.


 and Semiconductors (SMH): Concerning Price Pattern?")
 and Semiconductors (SMH): Concerning Price Pattern?")


