One of my favorite lines last week came from fellow See It Market contributor, Anne-Marie Baiynd: “Something about the market always feels like you’re looking at it through a house of mirrors…” (from her post “The State Of The Market“.
In an age of information overload, we are inundated with data, often with one data point seeming to contradict another. Because of this, it is important to view data over time in order to better understand how new information will impact market trends going forward… like slowdowns and new growth cycles.
Cheap Factor Costs of Labor and Commodities: What This Means Going Forward
Today, I’d like to look at the relationship between the factor markets of labor and commodities over the last few decades to help us navigate the Market’s “house of mirrors”.
First, let’s start off by looking at wages via a chart of the ECI (Employment Cost Index).
Employment Cost Index (1976-2016)
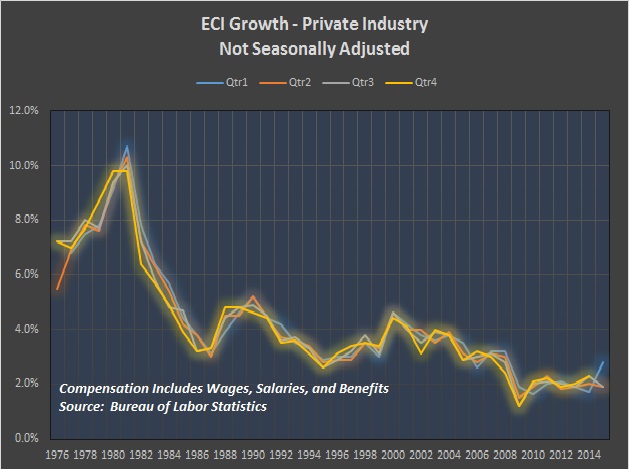
Figure 1, Employment Cost Index (1976-2016), by Bureau of Labor Statistics
The Employment Cost Index for the private industry demonstrates a striking trend in the sharp decline of wage growth over the last 35 years. Much of this period coincided with the Great Moderation, a term coined by our last Fed Chairman, Ben Bernanke, to describe what happened when the high inflationary and high unemployment environment of the 70’s (stagflation) gave way to a new growth cycle and more stable economic periods through the 1980’s and 1990’s.
Moreover, cheap labor in emerging economies produced goods for less, and that allowed US consumers to enjoy more bang for their buck despite slowing wage growth. However, it is important to note that in a consumer-led economy, wage growth peaks often lead to business cycle slowdowns and bottoms come during the early stages of recovery (new growth cycles). You can see this trend in the chart above, with wage growth peaking in late 1980’s, bottoming in 1994, and peaking again in 2000.
CRB Commodity Index Price Chart (1962-2016)
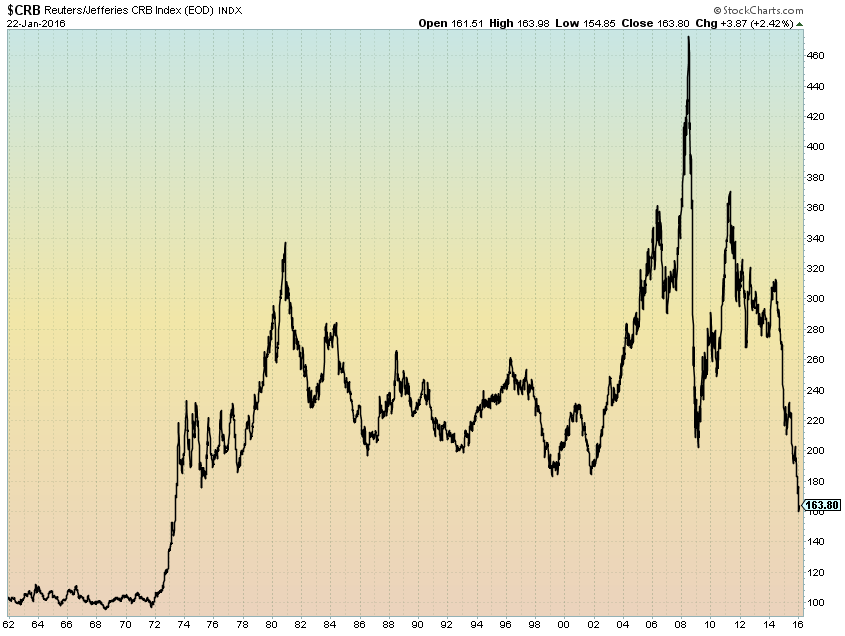
Figure 2, Reuters/Jefferies CRB Commodity Index, shared by Mike Zaccardi
In commodities, the trend has been more volatile, beginning with the Oil Crisis of 1973. However, it is notable that commodities saw lower highs from the early 1980’s until the 2000’s. Over the last decade, this trend was replaced by increased volatility that coincided with the growth story of the emerging markets, in which China exploded and took its place as the second largest economy.
Employment Cost Index Vs. Commodity Costs
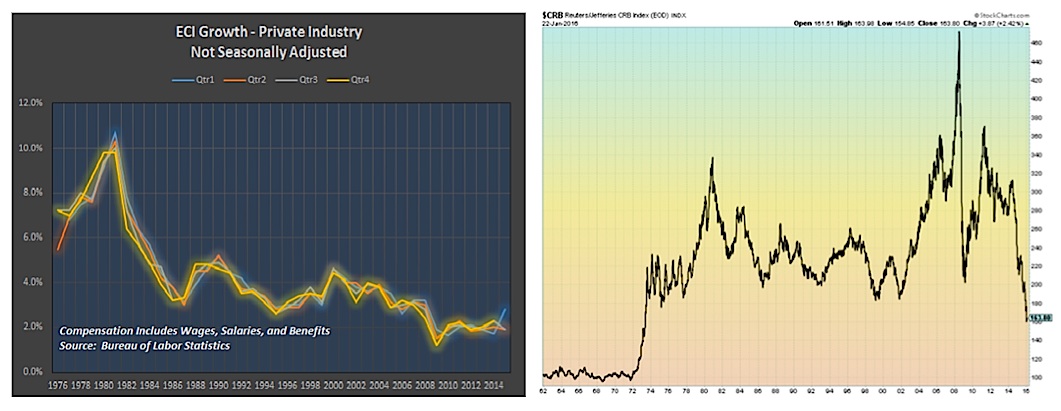
A side by side comparison of the cost of labor versus the cost of commodities provides us a visual to understand their important relationship. Notice again that the most stable economic period, the Great Moderation, coincided with lower highs in commodity costs. After the bottoming of labor costs in the late 1980’s, labor costs and commodities costs enjoyed a relatively predictable relationship.
Unsurprisingly, both lows are seen at the early stages of new growth cycles, and peak when real growth declines. Financial markets lag factor markets (labor and commodities). This is an important relationship to understand. Wage growth allows greater spending, which in turn drives more borrowing and lending, fueling economic growth. Eventually, factor costs will peak, impacting growth in markets for goods and services.
continue reading on the next page…

 Flirting With Critical Support… Again")


